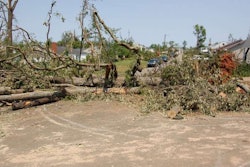
The U.S Department of Transportation will provide more than $215 million to states across the nation to cover the costs of repairing roads and bridges damaged by a variety of natural disasters, U.S. Transportation Secretary Ray LaHood announced on Nov. 28.
“Communities suffering from disasters have been hard at work restoring vital transportation links so that people can resume daily activities as soon as possible,” said Secretary LaHood. “They did their part, and now it’s our turn to give the states the money they were promised to help pay for that work.”
The Federal Highway Administration (FHWA) will provide a total of $215,198,775 from its emergency relief program to 34 states, Puerto Rico, the Virgin Islands, American Samoa, and federal lands agencies to reimburse them for repairs to roads and bridges caused by storms, flooding, hurricanes and other natural and catastrophic disasters.
“States and communities can continue counting on our support in times of need,” said FHWA Administrator Mendez. “Everyone pulls together when disaster strikes and we are committed to help as much as we can now and in the future.”
Among states that will receive funding, California will receive $43.4 million for flooding and earthquakes, North Dakota will receive $31.5 million for flooding in the Devil’s Lake region and Vermont will receive $15.4 million for flooding and damage from Tropical Storm Irene.
The money will reimburse states for fixing or replacing highways, bridges and other roadway structures. Costs associated with detours, debris removal and other immediate measures necessary to restore traffic flow in impacted areas are also eligible.
The FHWA’s emergency relief program reimburses states for the repair or reconstruction of federal-aid highways that were damaged in disasters and catastrophic failures.
|
EMERGENCY RELIEF PROGRAM FUND ALLOCATIONS (Source: U.S. Department of Transportation) |
|||
|
|
|
|
|
|
State |
Event |
Allocation |
Subtotal |
|
Alabama |
April 27, 2011 Severe Storms and Tornadoes |
1,896,010 |
1,896,010 |
|
Alaska |
Summer 2010 Taylor Highway Flooding |
1,368,882 |
1,368,882 |
|
American Samoa |
September 29, 2009 Tsunami |
1,229,844 |
1,229,844 |
|
Arkansas |
April 2011 Severe Storms and Flooding |
1,048,534 |
1,048,534 |
|
California |
Devil’s Slide |
20,785,705 |
43,430,449 |
|
January-March 1993 Storms |
305,000 |
||
|
February 1998 Storms |
2,149,300 |
||
|
December 2002 Winter Storms |
1,901,211 |
||
|
December 2004 Winter Storms |
5,089,071 |
||
|
December 2005 Winter Storms |
11,399,039 |
||
|
October 3, 2007 Mount Soledad Road Slide |
1,801,123 |
||
|
Connecticut |
Spring 2010 Flooding |
1,048,020 |
2,367,336 |
|
August 28, 2011 Hurricane Irene |
1,319,316 |
||
|
Florida |
January 2010 Sinkholes |
1,107,486 |
1,107,486 |
|
Illinois |
April 19, 2011 Heavy Rains and Flooding |
338,207 |
881,388 |
|
July 27, 2011 High Winds and Rainfall |
543,181 |
||
|
Indiana |
April 2011 Severe Storms and Flooding |
322,523 |
322,523 |
|
Iowa |
May 2011 Missouri River Flooding |
4,279,822 |
5,210,934 |
|
July 27, 2011 Rainfall and Flooding |
931,112 |
||
|
Kentucky |
July 2010 Storms and Flooding |
936,182 |
3,258,866 |
|
April 2011 Storms and Flooding |
522,684 |
||
|
June 19, 2011, Severe Storms and Flooding |
1,800,000 |
||
|
Louisiana |
August 29, 2005, Hurricane Katrina |
7,600,000 |
9,500,000 |
|
March 31, 2011 Vicksburg Barge Crash |
1,900,000 |
||
|
Maine |
July 18, 2008 Heavy Rains and Flooding |
416,216 |
755,397 |
|
August 28, 2011 Tropical Storm Irene |
339,181 |
||
|
Massachusetts |
June 1, 2011 Severe Thunderstorms and Tornado |
457,092 |
5,110,004 |
|
August 26, 2011 Hurricane Irene |
4,652,912 |
||
|
Minnesota |
March 2011 Spring Snowmelt and Flooding |
2,200,000 |
2,200,000 |
|
Mississippi |
March 31, 2011 Vicksburg Barge Crash (MDOT costs) |
7,886 |
3,769,791 |
|
April 2011 Severe Storms and Flooding |
1,623,283 |
||
|
April – June 2011 Mississippi River Flooding |
2,138,622 |
||
|
Missouri |
April – May 2011 Tornado and Flooding |
347,219 |
2,079,250 |
|
June 2011 Missouri River Flooding |
1,732,031 |
||
|
Montana |
Spring 2011 Flooding |
2,564,893 |
2,564,893 |
|
Nebraska |
May – June 2008 Flooding |
776,882 |
1,309,546 |
|
May 2011 Platt and Missouri River Flooding |
532,664 |
||
|
New Hampshire |
August 30, 2011 Tropical Storm Irene |
132,409 |
132,409 |
|
New Jersey |
August 2011 Hurricane Irene and Tropical Storm Lee |
7,387,595 |
10,184,159 |
|
August 2011 Flooding |
2,796,564 |
||
|
New York |
August 26, 2011 Hurricane Irene |
7,686,528 |
10,248,704 |
|
September 7, 2011 Tropical Storm Lee |
2,562,176 |
||
|
North Carolina |
September 29, 2010 Tropical Storm Nicole |
815,000 |
815,000 |
|
North Dakota |
Spring 2011 Runoff in the Devils Lake Basin |
10,171,839 |
31,530,138 |
|
Spring 2011 Runoff – Statewide |
10,048,855 |
||
|
Spring 2011 Runoff in the West James River Basin |
5,770,020 |
||
|
Spring 2011 Flooding in the Sheyenne/James River Basin |
1,082,263 |
||
|
ND11-5, Spring 2011 Flooding in the Southern Mouse River Basin |
4,457,161 |
||
|
Ohio |
March 2011 Jefferson County Landslides |
4,673,409 |
14,922,113 |
|
March – May 2011 Severe Rainfall |
10,248,704 |
||
|
Oregon |
January 2011 Flooding |
1,742,280 |
1,742,280 |
|
Pennsylvania |
August 26, 2011 Hurricane Irene |
2,500,000 |
4,242,280 |
|
September 7, 2011 Tropical Storm Lee |
1,742,280 |
||
|
Puerto Rico |
October 2010 Tropical Storm Otto |
841,155 |
2,564,373 |
|
August 21, 2011 Hurricane Irene |
1,723,218 |
||
|
South Carolina |
May 22, 2011 SC Route 150 Bridge Damage |
392,572 |
392,572 |
|
South Dakota |
Spring 2011 Flooding |
2,191,627 |
2,191,627 |
|
Tennessee |
SR 108 Rockslide |
918,706 |
4,802,307 |
|
April 5, 2011 US-441/SR-71 Rockslide |
1,107,630 |
||
|
April 19 – 26, 2011 Tornado and Flooding |
325,971 |
||
|
April 26, 2011 Severe Weather and Tornado Damage |
2,450,000 |
||
|
Texas |
August 30, 2011 Wildfires |
2,500,000 |
2,500,000 |
|
Utah |
December 20, 2010 Severe Storms and Flooding |
839,543 |
2,167,226 |
|
March – May 2011 Flooding |
1,327,683 |
||
|
Vermont |
Spring 2011 Flooding |
1,024,870 |
15,373,056 |
|
August 27, 2011 Tropical Storm Irene |
14,348,186 |
||
|
Virginia |
August 26, 2011 Hurricane Irene |
1,435,173 |
2,181,614 |
|
September 5, 2011 Tropical Storm Lee |
746,441 |
||
|
Virgin Islands |
October 2010 Tropical Storm Otto |
370,382 |
1,207,112 |
|
November 2010 Tropical Storm Tomas |
836,730 |
||
|
Washington |
February 28, 2001 Nisqually Earthquake |
3,433,316 |
9,879,273 |
|
November 2006 Storm |
1,429,586 |
||
|
December 2007 Storm |
512,287 |
||
|
January 2009 Storm |
290,705 |
||
|
October 11, 2009 SR 410 Landslide |
669,713 |
||
|
December 2010 Storms |
1,026,278 |
||
|
January 2011 Winter Storms |
568,372 |
||
|
March – April 2011 Storms |
500,000 |
||
|
March 22, 2011 113th Avenue Truck Crash Damage |
750,043 |
||
|
May 2011 Storms |
698,973 |
||
|
Federal Lands Agencies |
various events |
8,711,399 |
8,711,399 |
|
Total |
215,198,775 |
215,198,775 |
|


