The state with the country’s largest bridge and highway systems earned mixed grades on its latest infrastructure report card.
The bridges in Texas earned a B-minus, but its road and highway system got a D-plus, according to the 2021 Texas Infrastructure Report Card. The report card was released by the Texas Section of the American Society of Civil Engineers.
“D” means “poor, at risk.”
“B” means “good, adequate for now.”
One of the main challenges with the state’s highways and roads lies with rapid population growth, and that growth is expected to continue – along with more traffic congestion.
The second-most populous state is expected to see 57 percent growth by 2050, for a total population of 47 million people, according to the Texas Department of Transportation.
“From 2010 to 2016, daily vehicle travel rose nearly 16 percent, resulting in many Texas motorists seeing increased delays, limited roadway capacities and deteriorating conditions,” the report card says.
It adds that the “average Texan spends 54 hours in traffic” each year, costing each about $1,080 annually.
On top of that growth is a common problem throughout the country, gas tax revenues are not keeping pace. The report card estimates the state faces a $15 billion annual funding gap through 2040 between current funding levels and its road needs.
The report card comes after TxDOT recently reported it has more than $24 billion worth of transportation projects underway. That’s the largest amount in state history.
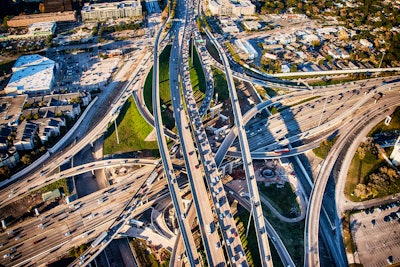
One main focus area is relieving traffic congestion, particularly in the state’s five metro districts: Austin, Dallas, Fort Worth, Houston and San Antonio. TxDOT established the Texas Clear Lanes non-toll initiative for those metro areas. The agency says six major projects under the program have been completed, 19 are under construction, and 18 are in planning. The projects are being funded by voter-approved measures in 2014 and 2015 to direct portions of oil and gas tax revenues, general sales taxes and other revenues to the State Highway Fund.


The report card indicates more is needed:
“While some of Texas’ urban centers are seeing trail and bikeway improvements and voters supported transportation funding increases in 2014 and 2015, a continued, collaborative effort from the public, state legislators and professionals is needed to ‘keep the foot on the gas’ in guiding the state’s roads in the right direction.”
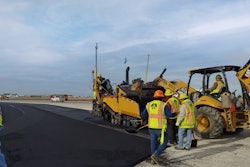
 Crews build prefabricated segments of replacement bridges for I-635 near Dallas in August 2020 for the state's first accelerated bridge construction project.Photo credit: Texas Department of Transportation
Better bridges
Though its highways and roads are overstressed, Texas ranks third for the lowest percentage of bridges in poor condition, at 1.5 percent, according to Equipment World’s 2020 Better Roads Bridge Inventory.
The report card noted that the state has the country’s largest bridge inventory “with an astounding 737 million vehicle crossings a day.” Such high traffic numbers, a low percentage of structurally deficient bridges and no crashes caused by poor bridge conditions resulted in the B-minus on the report card.
An area of concern, however, has been keeping up with maintenance on bridges rated good and fair, so they don’t fall into poor condition. The report card says an estimated $3.6 billion is needed each year for 10 years for bridge and culvert maintenance, and another $18 billion is needed to address bridges that are structurally deficient.
A ‘C’ average
Overall, Texas earned a “C” on its infrastructure report card, which is an increase from the C-minus it received in 2017, according to the Texas ASCE.
ASCE says a “C” means “mediocre.”
Here’s a rundown of the grades the state received in the 10 other infrastructure categories:
- Aviation (B-)
- Dams (D+)
- Drinking water (C-)
- Energy (B+)
- Flood risk mitigation (C-)
- Levees (D)
- Public parks and recreation (C-)
- Solid waste (B)
- Transit (B-)
- Wastewater (D)
For more details on the report card, click here.