The pandemic has created some changes to the country's traffic patterns, and for some states, it's meant even more vehicles on the road than before Covid-19 struck.
Vehicle miles traveled in the U.S. bottomed out in April 2020 at 40% below VMT for April 2019, according to a new report by TRIP, a nonprofit transportation research organization funded by equipment manufacturers and transportation engineering and construction firms, among others.
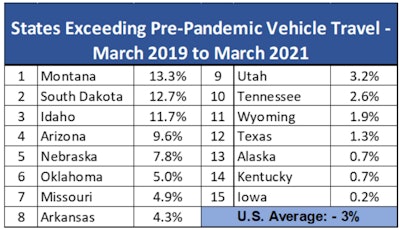
As of March 2021, VMT has nearly reached pre-pandemic levels at 3% below March 2019 data. And for 15 states, VMT has grown beyond their March 2019 levels.
 These 15 states are now exceeding the amount of vehicle miles traveled pre-pandemic.TRIP (using FHWA data)
(For the full chart showing each state's VMT percentage change ranking, see the bottom of this article.)
Rush hour changes
Evening commuting has been returning to March 2019 levels, as of early sping, but fewer drivers are making the morning drive to work.
Though the morning commute levels have not fully rebounded, mid-day traffic now exceeds pre-pandemic VMT, according to TRIP.
An April INRIX report indicates 45 of the 100 largest metro areas' VMT for evening commutes have returned to pre-pandemic levels, while only five of the metros' VMT for morning commutes have rebounded.
Work-from-home revolution
The TRIP report indicates that more people will continue to work from home and lead to a migration from dense, high-cost areas to less populated areas where housing costs are lower.
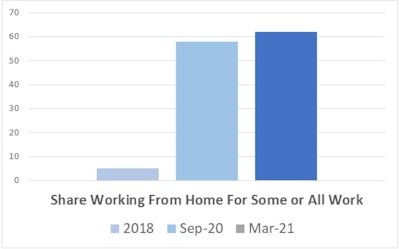
In 2018, it notes, 5% of employees worked remotely.
As of March 2021, 62% of households report at least one member working from home.
 The percentage share of households working from home before and during the pandemic.TRIP (using U.S. Census Bureau data)
What's it all mean?
TRIP Executive Director Dave Kearby says it will take years for the full extent of the pandemic's effects on U.S. transportation to emerge. So transportation planners will need to be flexible.
He also says federal and state funding for transportation must come with more leeway in how that money is spent.
“Meeting the nation’s post-COVID-19 mobility needs," he says, "will require that increased federal and state transportation funding provide state and local governments the flexibility to determine how best to improve their transportation system.”
State VMT rankings
The chart below, using data from TRIP's “Transportation Impact and Implications of COVID-19,” ranks each state's percentage change in vehicle miles traveled when comparing March 2019 and March 2021:
 States ordered from highest percentage increase of vehicle miles traveled to lowest.TRIP


