A great report from The Atlantic Cities brings two charts into focus that do a great job of illustrating why American infrastructure is struggling.
The charts were put together by Juan Gomez and José Manuel Vassallo for the Journal of Infrastructure Systems and compile data gathered between 2004 and 2009.
 Credit: Juan Gomez and José Manuel Vassallo
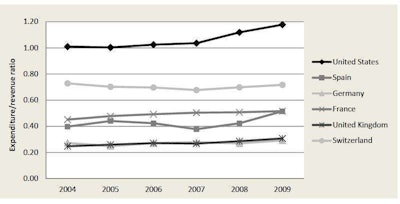
The first chart compares the United States’ ratio of road expenditures and revenue with other countries. A ratio over 1, like the U.S.’ 1.2, means that the country spends more on infrastructure than it brings in from tolls, taxes and vehicle fees. Each of the other countries listed actually profit from their road systems and can use the money to subsidize other programs. It’s the exact opposite here in the U.S.
 Credit: Juan Gomez and José Manuel Vassallo
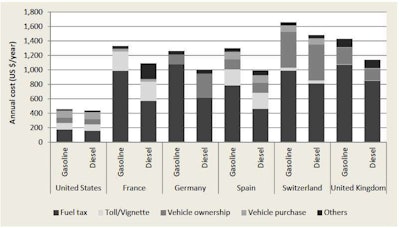
The second chart is particularly straightforward, showing how much roads cost the average American each year compared to citizens of other countries. On average, Americans pay $450 each year through gas taxes, tolls and fees. That’s three to four times less than drivers in other countries, according to the charts.
The charts point to a major discrepancy between fuel taxes here in the U.S. and in other countries. The federal gas tax hasn’t been raised in the U.S. since 1993 and is 83 percent lower for gasoline vehicles and 81 percent lower for diesel vehicles than to the same taxes in other countries.
However, some, like the Reason Foundation, believe the fairest answer to achieving more infrastructure funding is per-mile tolling of Interstate highways. And a survey done in May found that most Americans are more receptive to tolls than an increase in the gas tax.


