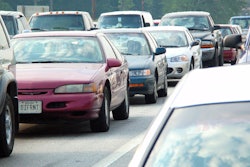
The Road Improvement Program’s (TRIP) recent report on major urban roads finds that 28 percent, including Interstates and freeways, are in substandard or poor condition providing “an unacceptably rough ride to motorists.”
Only 31 percent are in good condition, while the remaining 41 percent are in mediocre or fair condition. When counting major rural roads, TRIP says, 42 percent are in good condition, 40 percent are mediocre or fair, and 18 percent are poor.
For reference, TRIP used the Federal Highway Administration’s data gathered in 2013 using the International Roughness Index (IRI) and the Present Service Rating. An IRI value of 170 or more categorizes a road as substandard or poor. A PSR of 2.5 or lower represents substandard or poor conditions. Mediocre roads have an IRI of 120-170 and PSR of 2.6-3.0, fair roads have a 95-119 IRI and 3.1-3.4 PSR, and good roads have an IRI of 94 or less and PSR of 3.5 or more.
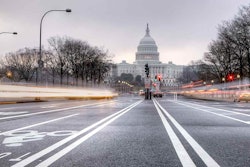
“The nation’s rough roads stress nerves and cost billions in unnecessary vehicle replacement, repair and fuel costs,” said Jill Ingrassia, AAA managing director of government relations and traffic safety advocacy. “Full investment in our nation’s transportation system will reduce the financial burden on drivers and provide them with a smoother, safer and more efficient ride.”
“The long-term preservation and maintenance of our national transportation system depends on federal investment,” said Bud Wright, executive director of the American Association of State Highway and Transportation Officials (AASHTO). “We can do better than the uncertainty of short-term extensions. America needs Congress to fully fund a multi-year surface transportation bill.”
In the report, TRIP ranked road conditions and additional vehicle maintenance costs due to those road conditions of the top 25 urban populations in two categories; 500,000 or greater in population, and between 250,000 and 500,000 in population.
In the largest category, the San Francisco-Oakland, California, area held the top spot in both percentage of poor roads (74 percent) and highest vehicle maintenance costs related to road conditions per motorist ($1,044).


For urban areas with between 250,000 and 500,000 people, Flint, Michigan, held the top spot in poor road conditions at 54 percent, while the Temecula-Murrieta, California, area was first in additional vehicle maintenance costs at $857.
Top 10 urban regions with 500,000 or more people, % poor road conditions
1. San Francisco-Oakland, California 74%
2. Los Angeles-Long Beach- 73%
Santa Ana, California
3. Concord, California 62%
4. Detroit, Michigan 56%
5. San Jose, California 53%
6. Cleveland, Ohio 52%
7. New York-Newark, New York 51%
8. San Diego, California 51%
9. Grand Rapids, Michigan 51%
10. Honolulu, Hawaii 51%
Top 10 urban regions with 250,000-500,000 people, % poor road conditions
1. Flint, Michigan 54%
2. Antioch, California 52%
3. Santa Rosa, California 49%
4. Trenton, New Jersey 48%
5. Temecula-Murrieta, California 47%
6. Scranton, Pennsylvania 46%
7. Reno, Nevada 46%
8. Spokane, Washington 44%
9. Jackson, Mississippi 44%
10. Lansing, Michigan 44%