Driving on bad roads in California costs the state’s drivers $61 billion each year, according to a new study by a national transportation research group.
Driving on California roads that are deteriorated, congested, and that lack some desirable safety features costs California drivers a total of $61 billion each year, according to TRIP.

The organization has calculated the cost to the average motorist in the state’s largest urban areas in the form of additional vehicle operating costs (VOC) as a result of driving on rough roads. It also calculates the cost of lost time and wasted fuel due to congestion, as well as the financial cost of traffic crashes.
The report examines the overall condition, use and safety of California’s roads, highways and bridges, and the state’s future mobility needs.
And when it comes to bridges, more than 1,500 of California’s bridges (20 feet or longer) are structurally deficient. That means there is “significant deterioration of the bridge deck, supports or other major components.”
More than half – 56 percent – of California’s bridges are at least 50 years old – the eighth highest rate in the nation, the TRIP report says.
Bridges that are structurally deficient may be posted for lower weight limits or closed if their condition warrants such action.
When it comes to public safety, a total of 15,730 people were killed in California traffic crashes from 2012 to 2016, an average of 3,146 fatalities per year, the researchers’ statistics show.
Traffic crashes in which roadway features were likely a contributing factor imposed $9.8 billion in economic costs in 2016, the researchers found.
Each year, $2.8 trillion in goods are shipped to and from sites in California, mostly by truck, according to the study. Increases in passenger and freight movement will place further burdens on the state’s already deteriorated and congested network of roads and bridges, the report says.
The design, construction and maintenance of transportation infrastructure in California supports 419,790 full-time jobs in the state, with workers earning $17.8 billion annually. About 7.1 million full-time jobs in California in key industries like tourism, retail sales, agriculture and manufacturing are completely dependent on the state’s transportation network, the report says.


In April 2017, the California legislature increased state revenues for transportation by increasing the state’s gasoline and diesel taxes, implementing a transportation investment fee on vehicles and initiating an annual fee on zero emission vehicles.
It is estimated that SB 1 will increase state revenues for California’s transportation system by an average of $5.2 billion annually over the next decade. On November 6, 2018, Californians will vote on Proposition 6, which, if approved, would repeal SB 1.
The elimination of SB 1 revenues would reduce funds available in California for transportation projects to improve road, highway and bridge conditions, improve traffic safety, enhance pedestrian and bicycle facilities, improve public transit and relieve traffic congestion.
Due to inadequate state and local funding, 68 percent of major roads and highways in California are in poor or mediocre condition, the report says.
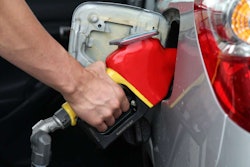
And that’s costing the average state driver an extra $843 annually in additional vehicle operating costs as a result of driving on rough roads – a total of $22.1 billion statewide.
To see more of the TRIP report, click here.