Forecasting Large Tractor Values
We are in a time of massive changes with shortage of new and late model used equipment. So, pricing used equipment and forecasting value is more important than ever before. We often read and hear about depreciation of used equipment, but this is an unusual time when we are able to take a closer look into something we rarely see… used tractor appreciation.
August Used Equipment Trends: Tractors > 100 HP
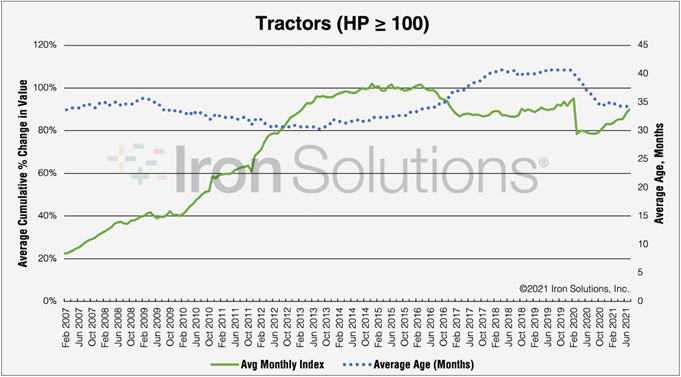
Figure 1
The chart in Figure 1 shows the average age of used tractors sold and an index value. The left axis shows the average cumulative percentage change in value. The right axis shows the average age in months of the equipment sold. The comparison of the two lines gives visibility as to whether actual prices are changing in the market or if prices only reflect a change in the characteristics of the machines sold.
For example, in a typical market, if the average age is lower, you would expect the change in value to go up. Conversely, if the age of the machine increases, its selling price would go down. That would be in a “typical market” scenario. But, can you remember when we last had a “typical market?” Today’s market is certainly not typical.
The last data point in the chart represents July 2021 where a high rate of increase in the index occurs while the average age remains steady at 34 months. Also, July marks the steepest increase from month to month since October 2018. July’s figure is part of a 10-month trend since September 2020 with a net increase of 11 percentage points.
The last time we saw a steep increase in the index value like this was 2011 thru 2013 when corn prices went up from $3.50 per bushel to above $5.50 until the Summer of 2013. Corn then stayed in the $3 to $4 range until 2021, when corn again went above $5.00. The price has remained there through the time of this writing ($5.18 on September 12, 2021). All this suggests that the corn price influences the demand for equipment and drives equipment prices higher.
Scarcity of Equipment
Unlike 2011 through 2013, however, there is a scarcity of equipment in play. Recently, we’ve heard reports of empty lots at equipment dealers. To get more insight, we can look at the duration of time that used tractors stayed on dealer lots. During the time following the high-priced corn of 2012 and 2013, there was a glut of used equipment. Many dealers had difficulty moving used inventory for the next four years. This is shown especially by the grey line in Figure 2 where some dealers were holding used tractor inventory for nearly a year. Since that peak in 2019, however, the average days used tractors stay on the lot has declined with some dealers holding inventory less than 50 days on average.
Used Inventory – Tractors – Average Days on Lot
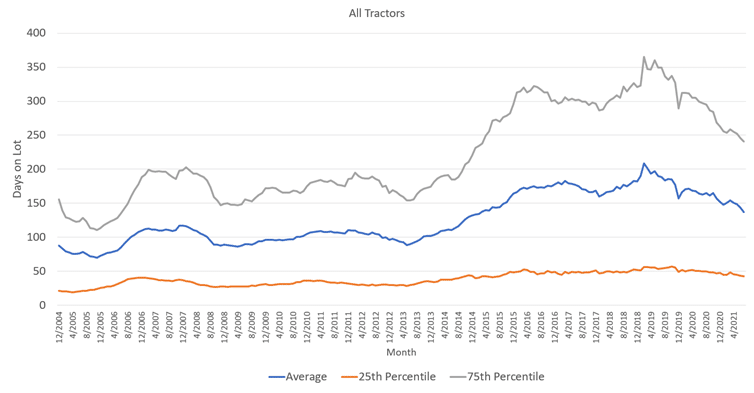
Figure 2
Let’s get specific
Let’s look into a set of six specific models, focusing on four-year-old high HP tractors equipped with quad tracks from John Deere and Case IH. 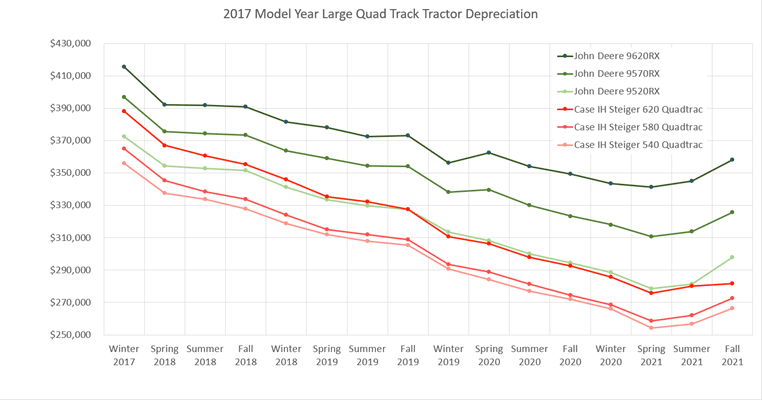
Figure 3
This chart shows the depreciation of each of these six 2017 models, by quarter, from 2017 through the Fall of 2021. Not surprisingly, the specific models here bear out the same uptick in values that we saw in the index value from Figure 1. It is unusual to see two consecutive quarters of appreciation especially at the rate we saw most recently, Summer to Fall of 2021. The average value of these six models gained nearly 5% since Spring of 2021 and just short of 7% for the John Deere 9520RX specifically.
What might the future hold?
Using a tool called IronForecastSM we can adjust some variables in a predictive model and look at some scenarios into the Fall of 2022. Among other variables, IronForecastSM allows us to adjust for future predictions in price volatility, used supply, and commodity prices.
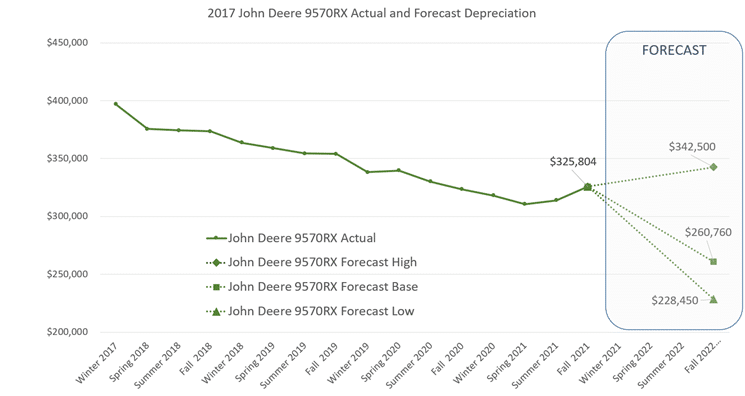
Figure 4
In Figure 4, the solid green line represents the actual used value of a typically-equipped 2017 John Deere 9570RX through the Fall of 2021. The three dotted lines represent three scenarios of what might happen to this model’s value in the next 12 months. The dotted line in the middle represents a base case, most representative of a typical market. The lower dotted line represents a scenario where used supply corrects to slightly above normal levels and corn goes back down to $3.00 per bushel. This scenario would produce an accelerated depreciation. On the other hand, if the used inventory supply remains constrained (by a factor of 70% of normal) and corn moves to $4.50, it is possible to imagine that this 5 year-old tractor regains all the value it lost since 2019. This scenario is represented by the high dotted green line.
So, what does this mean for buyers of high HP tractors?
While limited supply and high demand are pushing used prices up, it may be a time to consider buying new. If this trend continues, look for dealer and manufacturer incentives on new models to take advantage of this scenario. If you find a used model that you are interested in, you may want to act fast and be prepared to pay more than what you would expect in a “typical market.” Dealers, auctioneers and sellers in general are aware of the shortage and will adjust pricing accordingly. Have a look at current inventory and advertised prices of model year 2017 high horsepower tracked tractors.
Notes on this analysis
The impact of options on value is removed from this analysis by normalizing the units sold to their base value. This allows for an ‘apples to apples’ comparison of the products within a given category or model. Data in this analysis comes from Iron Solutions® and their products IronGuides®, IronAppraiser® and IronForecast®.
