Engineers concerned over the state of America’s bridges point to a lack of funding, a lack of adequate personnel dedicated to bridge maintenance and preservation – and a lack of emphasis by high-level management.
And, as they all know, the years-long practice of delaying major projects due to funding crunches eventually catches up when it comes to bridge maintenance.
“Funding remains the greatest obstacle in improving the condition of our bridges,” says the Pennsylvania Department of Transportation’s Asset Management Division’s response to Equipment World’s 2018 Better Roads bridge survey. “There is not enough funding to replace or rehabilitate all necessary bridges while maintaining the rest of our bridge population to ensure they do not become prematurely rated poor.”

In South Dakota, for example, state bridges overall are in good condition, but the local bridge inventory is aging and deteriorating, notes Cody Axlund, local government bridge inspection engineer for the state.
“While there is decreased funding for local bridges, the amount that needs to be replaced is simply too great,” Axlund writes in his 2018 Better Roads bridge survey.
“Many local agencies have resorted to replacing what they can, while closing and/or vacating the roadway and bridge for low ADT (average daily traffic) and minimum maintenance locations,” he says.
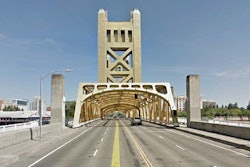
California challenge
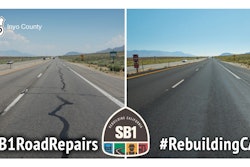
In California in April 2017, Senate Bill 1 created the Road Maintenance and Rehabilitation Program to address deferred maintenance on state highways and the local street and road system.
It provides an ongoing funding increase of about $1.8 million yearly for the maintenance and rehabilitation of the state highway system. The funds are to enable Caltrans to fix more than 17,000 lane miles of pavement and 500 bridges, among hundreds of other projects. This legislation, however, is being challenged in a November 6 ballot measure, the results of which occurred after press time. (See sidebar: Gas-tax repeal vote could set dangerous precedent.)


“Our infrastructure is aging, and funding has historically been insufficient to keep up with the growing demands,” notes Rita Gerlach, California bridge maintenance information manager, in our survey.
“Recent funding efforts will alleviate some of the shortfall, but preservation and rehabilitation needs will continue to increase. Caltrans’ asset management investment strategy will focus on preventive maintenance through stewardship activities, also known as a ‘fix it first’ approach.”
“Preventive maintenance,” Gerlach writes, “is intended to improve or preserve the condition of existing assets, rather than to expand system capacity.”
State funding increases
The federal 18.4-cent gas tax is charged on top of state gas taxes, which range from 12 cents to $1 a gallon.

Pennsylvania’s gas tax is the nation’s highest at 58.7 cents per gallon, followed by California at 55.22 cents and Washington at 49.4. Alaska has the lowest at 14.65 cents per gallon, followed by Missouri at 17.35 cents, according to API, an oil and natural gas trade association.
Nebraska has incrementally increased its fuel tax as part of 2015 legislation. The most recent increase was on January 1, from 8.5 to 9 cents per gallon, Nebraska DOT reports.
In Oregon, many bridges are “just a cusp away” from a poor rating, State Bridge Engineer Bruce Johnson says. State legislation passed in 2017 increased funding for transportation, including a small increase for bridges, he says. The HB 2017 legislation includes an incremental gas tax hike, which started with 4 cents this year. That will be followed by three more increases of 2 cents every two years until 2024, with the later raises conditioned on meeting accountability requirements, according to Oregon DOT.
In Delaware, increases in tolls and DMV fees have raised revenues for roads and bridges. There are 69 new bridges planned for the next fiscal year.
And in Georgia, legislation passed three years ago significantly increased funding for transportation needs. Only 1.5 percent of the bridges owned or maintained by the state are considered poor – and all of those are scheduled for replacement within the next three years.
Utah enacted a gas tax increase in 2016, joining the roster of states becoming more proactive in generating funding. The Legislature also allowed for bond issuances for major capacity projects throughout the state, says Rebecca Nix, Utah bridge management engineer.
“The greatest challenge is preserving the fair-condition bridges and keeping them from dropping into the poor category,” Nix says.
In gas tax legislation elsewhere, the Missouri Legislature passed a ballot initiative this year, says David Koenig, a DOT bridge management engineer. The measure, which was on the November 6 ballot, called for a 10-cent gas tax increase to be phased in over four years. Results of the election occurred after press time.
Additional sources of revenue
Because of stressed state budgets, how gas-tax revenue increases are designed becomes more crucial, says Alison Premo Black, chief economist for the American Road & Transportation Builders Association.
As an example, she points to Virginia, which changed its gas tax and put in a variable component dependent on the wholesale price of gasoline. It did not put in a price floor, so soon after, as the price of gasoline dropped, Northern Virginia had less funding than expected. In response, lawmakers moved to set a floor.

“Overall, we’re driving more so there is wear and tear on the roads, and as those vehicles become more fuel efficient in general, they just use less gas and they’re contributing less,” Black says.
Rising numbers of vehicles that are more fuel efficient, electric or hybrid mean that eventually states will generate less revenue from gas taxes. Seventeen states have adopted electric-vehicle fees, and nine more are considering them, according to the Sierra Club.
Every state should consider some type of electric-vehicle fee, Black says. “We are going to see that gradual erosion of revenues. That is not quite the cliff that people talk about, but it is coming. It needs to be addressed longer term.”
Since the recession, as budgets improved, a number of states have passed revenue increases for infrastructure, Black says.
“We’ve been climbing out of that. But then the curious thing is – despite 30-some gas tax increases, all sorts of new revenues, bond issues – the 2017 highway and bridge construction were both down about 7 percent. So again, this begs the question: With all these revenue increases, why is the market not increasing like it should?”
The five states with the lowest percentage of all bridges rated “Poor.”
1. Arizona, 1.33 percent
Arizona has 4,803 interstate/state bridges, of which 56 are rated poor – 10 fewer than a year ago. Using the good/fair/poor rating system, 63 percent of the interstate/state bridges in Arizona are rated good, while 1.2 percent are rated poor.
2. Nevada, 1.34 percent (tie)
Nevada has 1,208 interstate/state bridges, of which only 15 are rated poor, which is in line with the local bridges’ low number that are in poor condition. Nevada DOT gives their bridges a “4” rating, noting they have almost as many bridges rated fair (935) as good (1,027).
2. Texas, 1.34 percent (tie)
In Texas, 1.3 percent of its 54,082 bridges are rated poor, according to state DOT figures. The state has a total of 460,621,709 square feet of interstate/state bridge deck area, of which only 1.03 percent is rated poor. In addition, there’s another 79,617,903 square feet of local bridge deck area, of which 1.15 percent is rated poor.

Utah has 1,961 interstate/state bridges, only nine of which are rated poor. Another 48 city/county/township bridges are rated poor out of 1,057 total, reports Rebecca Nix, bridge management engineer. All poor-condition state-owned bridges in Utah are programmed to be repaired or replaced in the next four years. “The greatest challenge is preserving the fair-condition bridges and keeping them from dropping into the poor category,” Nix reports.
4. Vermont, 2.34 percent
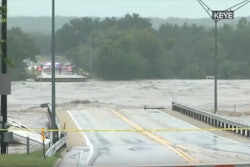
Vermont has 2,738 bridges, with only 64 rated poor, according to the DOT. In the good category, Vermont lists 518 interstate/state bridges and another 930 city/county/township bridges. The state has closed only one to three bridges in the past year due to deficiency, structural failure or collapse.
The five states with the highest percentage of all bridges rated “Poor.”
1. Rhode Island, 20.8 percent
The state has enacted the RhodeWorks 10-year plan, a $4.9 billion campaign to upgrade infrastructure to good condition by 2025. Meanwhile, limited truck tolling has helped raise revenues. Of 402 interstate/state bridges, 85 are rated poor. Of 17 local bridges, two are rated poor.

Iowa has 24,215 bridges, according to the Federal Highway Administration. Of those, 4,805 are ranked poor. The overall total bridge count also includes 9,096 bridges that received a good rating. Another 10,304 bridges received a fair rating, according to the FHWA Bridges and Structures 2017 statistics.
3. West Virginia, 18.7 percent
West Virginia has 7,228 bridges, of which 1,351 are rated poor. Of that remaining total, the biggest chunk – 3,645 bridges – are rated fair. Another 2,232 bridges are rated good, according to FHWA statistics.
4. South Dakota, 16.8 percent
In South Dakota, 10-plus bridges have been closed in the past year because of deficiency, structural failure or collapse. Of those, four to six have been repaired or are slated for repair. Cody Axlund, local government bridge inspector, hopes to lower the rate of bridges rated poor, though many old structures are on the local inventory. “If the rate of deterioration starts advancing quicker than we can get them replaced,” Axlund says, “this goal may not be met.”
5. Pennsylvania, 16.6 percent
Pennsylvania plans to lower the number of its bridges rated poor through its P3 – Rapid Bridge Replacement Program. The DOT’s Asset Management Division says it is working to reverse the state’s standing as one of the worst in terms of having the most bridges rated poor, both by count and percentage.