In California, for example, Senate Bill 1 created the Road Maintenance and Rehabilitation Program, which included a 12-cents-per-gallon increase in the state’s gas tax starting in November. The measure will fund “more than $52 billion in the next decade specifically for the maintenance and repair of the state highway system,” says Rita Gerlach, bridge maintenance information manager for Caltrans. California completed 12 state highway bridges and started another 36 last fiscal year, while another five bridges are being planned.
In August, Oregon’s governor signed a bill authorizing $5.3 billion in transportation funding to be spread over 10 years, while incrementally increasing the state’s gas tax by 10 cents per gallon over seven years.
And in Tennessee, legislators increased the gas tax by 6 cents per gallon over the next three years. The initial 4-cent increase started in July. The legislation will provide transportation funds in a three-pronged approach: $250 million to the Tennessee Department of Transportation, $70 million to counties and $35 million to cities. “This dedicates funding to a specific list of priority projects on state and local roads,” says Ted Kniazewycz with the state’s DOT.
Other states increasing funding this year include Indiana, Montana, West Virginia and South Carolina.
Transitioning from SD to Poor
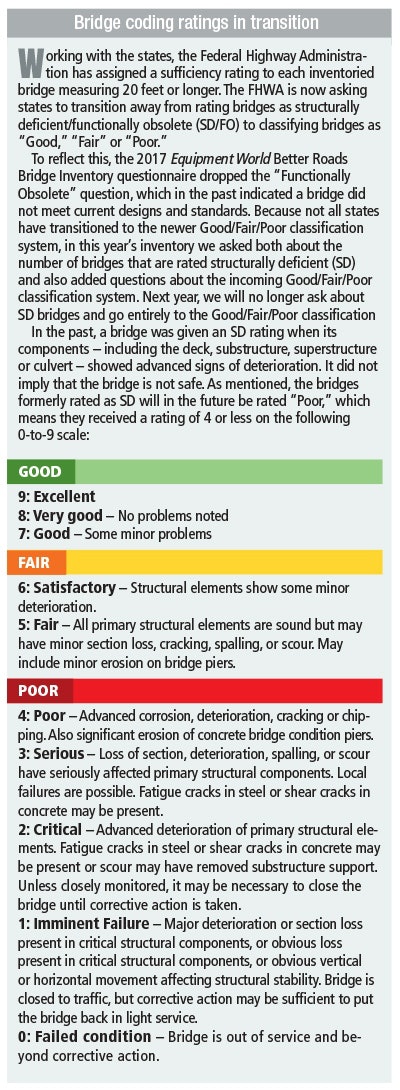
The Federal Highway Administration is transitioning from defining bridges of concern as “Structurally Deficient” (SD) to “Poor” under its newer Good/Fair/Poor condition rating system. Also being transitioned out are the terms “functionally obsolete” and “sufficiency rating.” The definition of the term “fracture critical” (now classified as “a steel member in tension, or with a tension element, whose failure would probably cause a portion of or the entire bridge to collapse”) will be updated.
The goal is to eliminate “sometimes confusing, unclear, misleading or alarming terms from the language of bridge engineers,” said Joey Hartmann, FHWA director of the Office of Bridges and Structures, in a presentation to the American Association of State Highway and Transportation Officials in June. While this language served engineers well, FHWA now recognizes they do “not translate well in a transparent world,” Hartman said.
In addition, on May 20th, FHWA published the final rule establishing performance measures based on deck
area for state DOTs to use in managing pavement and bridge performance on the National Highway System. This will require state DOTs to establish two- and four-year targets by May 20, 2018, and report targets by Oct. 1, 2018, in a baseline performance period report.
Since the terminology is still in transition, and many states still use SD as a term, in our survey we asked for both the number of SD bridges and the number of Good/Fair/Poor condition bridges. In determining the ranking of states, however, starting on page 30, we opted for the incoming Good/Fair/Poor rating.
Lowering the number of SD/Poor bridges
More than half of the states and areas responding to this year’s survey say they expect in the coming year to lower their rate of SD bridges – which again, would be termed “Poor” under the new classification system. The District of Columbia is one of them. “Since 2010, we have reduced the number of SD bridges from 23 to five,” says
Terry Owens, District DOT public information officer. “In the next two years, we project all of the bridges currently rated SD will be under construction and design. And the American Society of Civil Engineers recently gave the District a B-minus rating for bridges in its infrastructure report card.”
Oklahoma expects to reduce on-system SD bridges by 80 this year, reports Walt Peters, assistant bridge engineer-maintenance, Oklahoma DOT. “We are on track to have less than 1 percent of our on-system bridges rated SD by 2020,” he says.
Paul Kulseth, bridge management engineer
Kentucky is concentrating on keeping bridges from becoming SD, says David Steel with the Kentucky Transportation Cabinet. If instead the state has to use its maintenance budget to repair bridges damaged by oversized loads, “it reduces the number of bridges we can keep from becoming SD,” he says.
Nebraska expects to decrease its number of SD bridges through increased allocation to the County Bridge Match program that targets small SD bridges on local systems, says Kent Miller, assistant bridge engineer, Nebraska DOT. “However, the rate of deterioration appears to slightly exceed the rate of improving conditions overall,” he says.
“Addressing the 67 SD state-owned bridges is a top priority,” says Maurice Agostino, deputy director of the Office of Structures with the Maryland DOT.
Impact of Atlanta’s I-85 collapse
In March, the I-85 bridges over Piedmont Avenue in Atlanta were destroyed by fire, becoming the biggest bridge story of 2017 to date. It made us curious. How were DOTs responding to the lesson learned about storing combustible materials under bridges, one of the contributing factors to the I-85 fire?
Almost half of the 43 entities responding to our survey said they had reviewed and/or changed how they store materials under bridges. Caltrans, for example, identified the need for a policy specific to material storage under bridges, which it expects to adopt by year’s end, says Gerlach. In Delaware, the DOT reviewed its bridge inventory to identify bridges with storage materials and worked with various entities that had stored materials to have the materials removed, says Jason Arndt, Delaware DOT. It’s also adopting an official policy.
In Kansas, the DOT updated its policy to include photos of stored materials during routine bridge inspections. “Regional DOT offices now review existing legal agreements or permits,” says Kulseth.
Some states – including Maryland, Utah and Nevada – had policies in place that prohibit storing materials under a bridge.
Accelerated Bridge Construction
The I-85 bridge collapse also offered a showcase of Accelerated Bridge Construction (ABC) techniques, since the critical bridge was replaced and opened under emergency measures in 47 days. This prompted us to ask how many other states were using ABC processes and what techniques they were using.
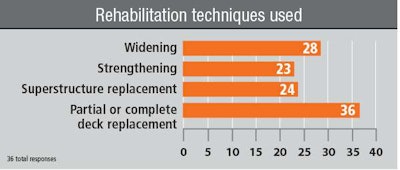
And although the I-85 bridge replacement made headlines, Georgia DOT State Bridge Engineer Bill DuVall points to another ABC project: replacing the State Road 299 bridge over I-24 in Dade County. “The contractor, Wright Brothers, built the superstructure adjacent to the existing bridge,” he says. “During the weekend closure, they removed the existing bridge and placed the new bridge using self-propelled modular transporters. The total road closure lasted 81 hours.”
The Louisiana Department of Transportation and Development also used self-propelled modular transporters to remove a damaged portion of a curved steel-plate, two-girder system on a U.S. 61 ramp over I-10, reports Bill Vaught, assistant bridge design engineer administrator.
Poor condition bridges: top and bottom states
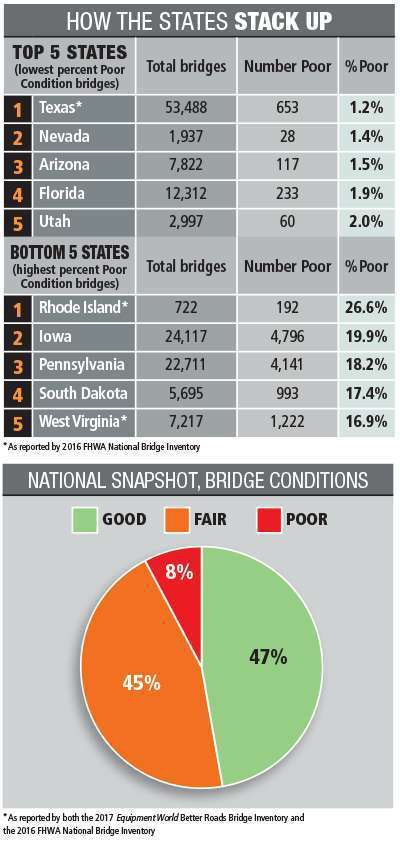
As mentioned, Equipment World opted to use the incoming Good/Fair/Poor condition rating in ranking states this year.
The five states with the lowest percentage of all bridges rated “Poor.”
1.Texas, 1.2 percent
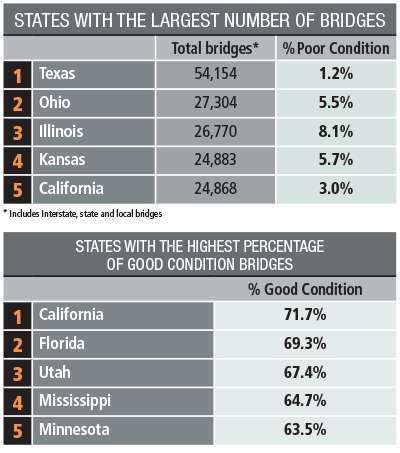
In Texas, 1.2 percent of its 53,488 bridges are rated “Poor,” according to the 2016 FHWA National Bridge Inventory. The state has a total of 463,549,151 square feet of interstate/state bridge deck area, of which 0.97 percent is rated SD. In addition, there’s another 81,923,863 square feet of local bridge deck area, of which 1.2 percent is rated SD.
2.Nevada, 1.4 percent
According to Troy Martin and Lisa Green with the Nevada DOT, 28 of the state’s 1,937 total bridges are rated SD. The state has 13,723,241 square feet of interstate/state bridge deck area, 0.63 of which is rated SD. There’s another 5,278,297 square feet of local system bridges, 1.2 percent of which are SD. The department anticipates completing 20 new bridges in the next fiscal year, starting another 10 bridges, and planning 10 more. When asked what one thing would help improve bridges in the state, they said, “Allocate more bridge maintenance staff and equipment to do more preventive maintenance.”
3. Arizona, 1.5 percent
Arizona has 4,809 interstate/state bridges, of which 66 are rated SD. Using the Good/Fair/Poor rating system, 63 percent of the interstate/state bridges in the state are rated Good, while 1.5 percent are rated Poor.
4. Florida, 1.9 percent
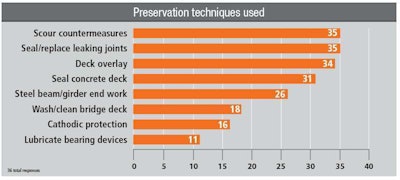
With a total of 11,976 bridges in both interstate/state and local systems, Florida DOT says 244 of them are considered SD. The state is using several preventive maintenance techniques to prolong bridge life, says John Clark, state bridge maintenance and repair engineer, including installing deck overlays, sealing concrete decks and installing cathodic protection systems.
5.Utah, 2.0 percent
“At this time, all but two state-owned SD structures are programmed for rehabilitation or replacement, including several that are under construction now or will be in the current year,” says Rebecca Nix, bridge management engineer with the Utah DOT. The state’s greatest challenge is staying ahead of its aging bridge inventory, Nix says. “More focus needs to be placed on extending the life of Fair condition bridges to prevent a rapid increase in Poor condition bridges,” she reports. Asked what one thing would help improve bridges in the state, she mentioned a better understanding of the use of non-destructive testing for an accurate evaluation of bridge condition. This would help the Utah DOT to “better scope needed repairs and prioritize their treatments,” she says.
The five states with the highest percentage of all bridges rated “Poor.”
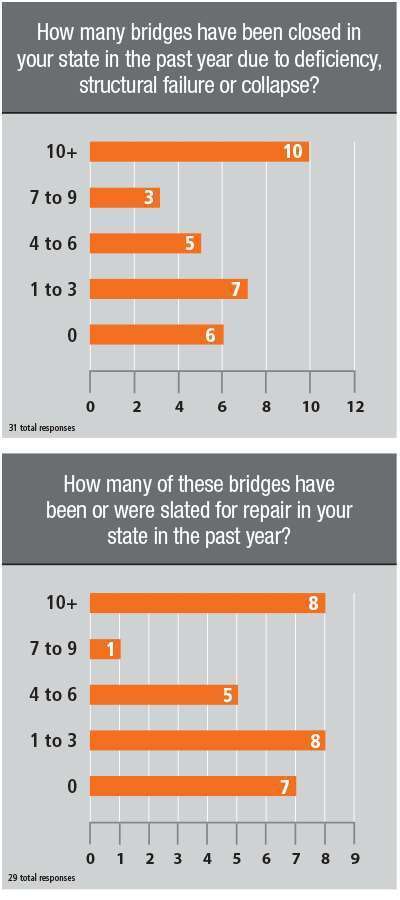
The Rhode Island DOT reports it has 6,680,195 square feet of interstate/state bridge deck, and 24.02 percent of this bridge deck area was rated SD. It closed and slated for repair one to three bridges because of deficiency, structural failure or collapse. The state expects to complete four new bridges in the next fiscal year, start 21 and plan another 27, according to Craig Nazareth with the department. Rehabilitation techniques used include superstructure replacement and strengthening.
2. Iowa, 19.8 percent
Most of the problems with Iowa bridges rest in local systems, where 25 percent of the bridges are considered SD. If just considering interstate/state bridges, only 1.2 percent would be classified SD. Currently, 37.6 percent of bridges in all systems are rated Good, 42.6 percent are rated Fair, and 19.8 percent are rated Poor. According to Scott Neubauer, Iowa DOT bridge maintenance and inspection engineer, preventive maintenance techniques used by the state include washing/cleaning bridge decks or the entire bridge, installing deck overlays, and sealing and replacing leaking joints.
3. Pennsylvania, 18.2 percent
When asked to rate the bridges in his state on a scale of 1 to 5 (with 5 being excellent), Michael Winslow with the Pennsylvania DOT said “2.” “We are near the worst in the country in terms of having the most SD bridges by count and percentage,” he said. The state is planning to replace 182 bridges this fiscal year. It closed more than 10 bridges in the past year due to deficiency, structural failure or collapse, and slated another 10-plus structures for repair.
4. South Dakota, 17.4 percent
In comments to our survey, the South Dakota DOT gave itself a score of 3.5 on a scale of 1 to 5. “State bridges are good, but local bridges are aging at a quicker rate than what can be replaced,” said the department. “The greatest challenge for counties has been deciding which bridge to replace and which they can do without, which means closing or vacating the roadway and bridge.”
5. West Virginia, 16.9 percent
According to the 2016 FHWA National Bridge Inventory, West Virginia has 7,712 bridges in all systems, 36.6 percent of which are rated Good, 46.5 percent Fair and 16.9 percent Poor.

