Much has stayed the same from last year’s survey. There’s still roughly a 50/50 split between those using smartphones and those who don’t, which has remained consistent over all three surveys. And the level of respondents using their smartphones to email, text, visit websites, watch videos and visit social media all track within 3 percentage points plus or minus of what was reported last year.
The one standout is how many of our respondents say they are using apps on their phones, up 11 percent from last year, and 28 percent from our 2011 survey.
Curiously, with smartphone adoption remaining the same, the number of respondents saying they’re getting specific types of information on their smartphone dropped, especially in comparison with last year’s survey. Those getting bid information, for example, dropped from 52 percent in 2013 to 36 percent in this year’s survey. Other drops included general equipment information, 42 percent, down from 61 percent the year before; and equipment specs, 30 percent compared to last year’s 40 percent.

Tablet use has grown, moving from 2 percent in 2011 to 10 percent now, but is still a distant third to desktop (51 percent) and laptop (32 percent) computers.
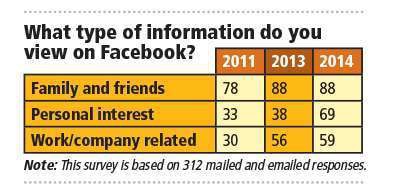
Social media use is edging up, moving from 36 percent in 2011 to 42 percent in 2014. Facebook is still the king, with 88 percent of those who visit social media sites reporting they go on Facebook. Keeping up with friends and family is still number one, but those saying they’re also looking at personal interest pages and posts rose from 38 percent in 2013 to 69 percent this year.
One tiny social media surprise: although the amount of those saying they visit Twitter is still a small 17 percent, respondents who say they visit Twitter daily rose from 19 percent last year to 58 percent in the current survey.
Some results reflect the market at large, such as the decline of Blackberry phones. In 2011, 28 percent of our respondents said they used Blackberry; today, it’s 7 percent. The reverse has happened with iPhones; now 51 percent of respondents are using them, compared to 24 percent in our first survey. Android use has seen more moderate growth, from 29 percent to 37 percent.


