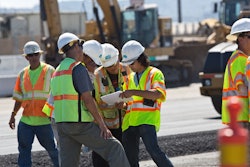
Survey results indicate 79 percent of the 1,312 responding contractors will expand their workforce, mostly to keep up with demand, AGC says. That’s up from 75 percent from the 2018 outlook survey. At the same time, 78 percent report having difficulty hiring workers – the same level as the 2018 survey.
The worker shortage was cited as the top concern of contractors for 2019, at 30 percent.
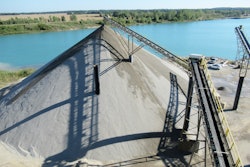
Despite the trade war with China, only 4 percent of contractors cited rising material costs as a top concern. AGC officials said, though, that the survey was conducted around the time the Trump administration had announced a 90-day truce with China. The survey was also conducted before the partial federal government shutdown.
Should those issues not be settled soon in the new year, AGC officials say, then contractors’ optimism about the year ahead could erode. AGC CEO Stephen Sandherr said the association plans to push for more infrastructure funding, regulatory reforms, federal funding for career and technical training, and immigration reform.
“Our goal is to ensure that the construction industry expands in 2019 amid growing demand for new projects and an infusion of new and qualified workers,” Sandherr said. “If that happens, the entire economy will benefit.”
Labor costs rising
For the latest survey, finding workers is the main issue facing contractors, and it’s costing them more money.
Most of the firms (59 percent) reported raising pay during 2018 to attract and keep workers. And 29 percent reported providing incentives and bonuses, while 21 percent said they improved employee benefits.
The labor shortage has also led to higher costs than expected for 33 percent of contractors. Projects have taken longer for 34 percent of contractors, and 37 percent said they have added higher prices into bids or contracts.


Most contractors (63 percent) said they planned to spend more on employee training costs in 2019 over 2018.
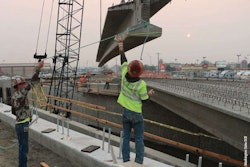
Contractors also reported that the worker shortage and inexperienced workers create safety concerns, with 43 percent citing it as the biggest challenge to workers’ safety and health.
Adding technology
Along with increased spending to deal with the worker shortage, 42 percent expect to spend more on technology in 2019.
Technology likely to get the most attention include software for project management, document management, estimating, scheduling, Business Information Modeling, accounting, fleet tracking and management, project collaboration and human resources.
The biggest tech challenges facing contractors are time needed for training and implementation, employee resistance to technology, communication between field and office, connectivity to remote jobsites, and keeping company data secure from hackers.
Sector breakdown
The survey posted the following results when asking contractors about their expectations for dollar volume in 2019 when compared to 2018:
| Market | Higher | Lower | Same | Net* |
| Public Building | 28% | 11% | 60% | 17% |
| Highway | 30% | 14% | 56% | 16% |
| K-12 School | 32% | 16% | 53% | 16% |
| Hospital | 31% | 15% | 54% | 16% |
| Retail, Warehouse, Lodging | 29% | 14% | 57% | 15% |
| Federal (e.g., VA, GSA, USACE, NAVFAC) | 26% | 12% | 62% | 15% |
| Transportation (e.g., transit, rail, airport) | 29% | 14% | 57% | 14% |
| Water/Sewer | 27% | 13% | 61% | 14% |
| Private Office | 26% | 13% | 60% | 13% |
| Manufacturing | 29% | 16% | 55% | 12% |
| Higher Education | 26% | 15% | 59% | 11% |
| Power | 23% | 14% | 63% | 10% |
| Multifamily Residential | 26% | 21% | 52% | 5% |
| Other | 32% | 11% | 56% | 21% |
*Net equals difference between number of “Higher” and “Lower” responses as percent of total.