Rural roads and bridges are falling behind in conditions and in traffic fatalities compared to all other U.S. roads and highways, according to a new report from national nonprofit transportation research group TRIP.
The TRIP report determined that the country faces a $180 billion backlog in repairs and improvements for rural roads, highways and bridges. It also ranked the states on their percentage of rural roads and bridges in poor condition. (See the chart at the end of this story to see how the states rank.)
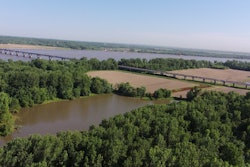
One of the main deficiencies of rural roads is their inadequate capacity and inability to handle the growing freight traffic many areas face. They also lack safety features, such as guardrails, cable barriers and rumble strips.
“Rural roads are more likely to have narrow lanes, limited shoulders, sharp curves, exposed hazards, pavement drop-offs, steep slopes and limited clear zones along roadsides,” says the report Rural Connections: Examining the Safety, Connectivity, Condition and Funding Needs of America’s Rural Roads & Bridges.
That has made crashes and fatalities on rural roads disproportionately higher than on all other U.S. roads. The report cites a fatality rate of 2.17 deaths per 100 million vehicle miles of travel for non-interstate rural roads in 2020. That’s twice as high as the 1.09 rate for all other roads.
It also notes that rural roads carried 23% of all vehicle traffic, but they accounted for 38% of the fatalities in 2020.
By the numbers
Some other findings of the report:
- 12% – Percentage of U.S. rural roads rated in poor condition.
- 19% – Percentage in mediocre condition.
- 17% – Percentage in fair condition.
- 51% – Percentage in good condition.
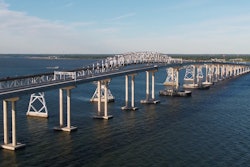
- 8% – Percentage of rural bridges in poor condition. Poor is defined as significant deterioration to major components.
- 48% – Percentage rated fair. Fair means minor deterioration on deck, substructure or superstructure.
- 44% – Percentage in good condition.
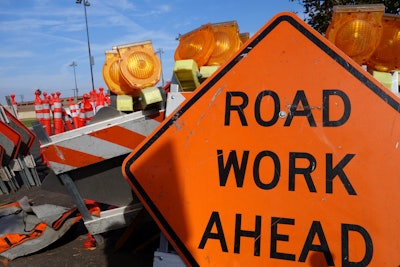
Infrastructure funding to help
Of the $180 billion backlog, the TRIP report cites the following needs:
- $109 billion backlog for rural road and highway rehabilitation.
- $35 billion for rural bridge rehabilitation.
- $36 billion for rural roadway improvements.
The report cites the $1.2 trillion infrastructure law enacted in 2021, which provides $454 billion through 2026 for transportation infrastructure and a 38% increase in federal funding in 2022, as bringing much-needed investment in rural transportation infrastructure. The law includes $2 billion for the Rural Surface Transportation Grant Program.
How the states rank
The chart below from the TRIP report ranks states based on their rate of rural pavements in poor condition, share of rural bridges that are rated poor/structurally deficient, and fatality rates on non-Interstate rural roads.


 TRIP
TRIP