The Cedar Avenue Bridge in Minneapolis.
Minnesota Department of Transportation (MnDOT) researchers are using a database of historical bridge deck inspection and construction reports to help determine estimated times when current bridges need to be repaired.
MnDOT researchers reviewed 2,601 reports dating back “decades”. After analyzing the reports, they were able to create predictable curves that showed when bridge conditions degraded to the next worse condition. They created a number code to rank these conditions.
Here are few variables they found that affected deterioration speed:
Epoxy-coated bars
Decks built without them between 1975 and 1989 deteriorated faster than any other bridge decks.
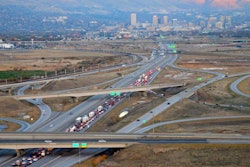
Located in metropolitan areas
Bridges in these areas deteriorated faster than in other parts of the state, possibly due to delayed maintenance, such as sealing cracks, because of traffic volume. Another reason MnDOT assumes is increased use of chemical deicers.
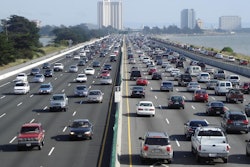
Traffic volume
Seemingly self-explanatory, MnDOT found that bridges with less traffic deteriorated slower than bridges with high traffic volume.
New decks
Again, this would seem self-explanatory. But MnDOT said that because a new deck on an existing bridge “performs like a brand-new bridge,” the deterioration table should calculate the year it was re-deck, rather than when it was first built.
MnDOT said it is adding upcoming bridge inspections into the database “to enhance the predictive value of the deterioration tables.”
The research report can be accessed here.