Over regulated, underfunded and disheartening.”
That’s how Brian Olson, bridge replacement engineer with the South Dakota Department of Transportation, describes the past 12 months for his department in terms of work and funding.
There is no avoiding the obvious – our economy and spending on transportation infrastructure are both weak and showing precious little signs of a sudden, strong and prolonged revival. But despite the doom and gloom that’s been cast on U.S. infrastructure, the state of the nation’s bridges could be said to be a little bit encouraging.
 A Five-Year Look at America’s Bridge Inventory
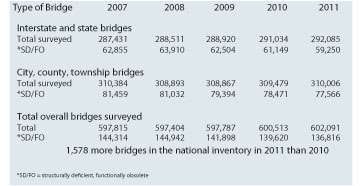
Better Roads’ annual Bridge Inventory reveals that the total number of structurally deficient (SD) and functionally obsolete (FO) bridges (combined) has dropped from 23.3 percent last year to 22.7 percent this year. That means 136,816 of the total 602,091 bridges surveyed are SD/FO (combined) this year. Last year, 600,513 bridges were surveyed and 139,620 of them were SD/FO (combined).
Of the nation’s 292,085 total interstate and state bridges, 59,250, or 20.3 percent, are SD/FO (combined). In 2010, Better Roads reported 61,149, or 21 percent, of the 291,034 total interstate and state bridges were SD/FO (combined).
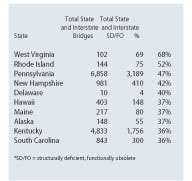
 Highest Percentage of SD/FO State/Interstate bridges
There are 310,006 total city/county/township bridges in the United States, and 77,566 – or 25 percent – are SD/FO (combined). In 2010, of the 309,479 reported total city/county/township bridges, 78,471 (25 percent) were considered SD/FO (combined).
There has been steady decline in the number of overall SD/FO combined bridges in the United States, as well as the number of SD/FO combined bridges at the interstate and state level and at the city/county/township level since Better Roads first began archiving its Bridge Inventory in 1985. In fact, there has been a 19.8-percent decline in overall total SD/FO combined bridges. In 1985, 42.5 percent of the total 586,241 bridges surveyed in the nation were SD/FO combined. (The survey was started in 1979, but the data were not archived until 1985, the year the survey received responses from all 50 states and the District of Columbia.) Ten years later, 591,205 total bridges were surveyed and 187,504, or 31.7 percent, were reported as SD/FO (combined). In 2005, the Bridge Inventory’s total number of surveyed bridges grew to 595,625, but only 25 percent, or 149,126 were SD/FO (combined). From 2006 to 2011, there has been a 1.8-percent drop – from 24.5 percent to the current 22.7 percent – in the number of SD/FO combined bridges.
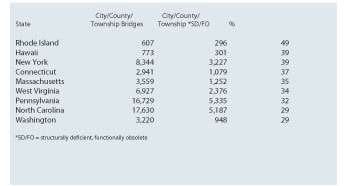
 The top states with the most city/county/township SD/FO bridges
Looking at the numbers state-by-state, the majority of jurisdictions have slightly, decreased the number of SD/FO (combined) bridges. It may be baby steps, but it’s a move in the right direction.
But one exception with a significant rise in percentage was Washington, D.C., which has jumped from 41 percent in 2007 to a current rate of 61 percent.
Wyoming moved from 12 percent in 2007 to 14 percent in 2011; Illinois from 18 percent in 2007 to 16 percent in 2010 but back up to 17 percent this year; Georgia with a 1-percent decrease and increase – 20 percent in 2007, 19 percent from 2008 to 2009, 20 percent in 2010, and back down to 19 percent this year. Delaware has slowly increased, from 18 percent in 2007 to the current 20 percent. Connecticut was at 33 percent in 2007 and has been at 36 percent since 2008. Arizona had 6 percent of its total bridges SD/FO (combined) in 2007, but jumped to 10 percent in 2008 and then 11 percent in 2009, only to drop down a percentage point again in 2010 and remain there this year.
Alaska, California and Colorado also experienced increases of a percentage point between 2007 and 2010, but are now back down to the lowest percentage in five years. Alaska was at 22 percent in 2007, went up to 23 percent from 2008 to 2010, but went back down to 22 percent this year. California went from 18 percent in 2007 to 19 percent in 2008, but returned to 18 percent last year and has kept the status quo. Colorado had the same pattern. The Rocky Mountain State had 13 percent of its total bridges classified as SD/FO (combined) in 2007 and that increased to 14 percent in 2008, then dropped back down to 13 percent in 2010 and has stayed at this percentage.
Texas has the most bridges in the nation, 51,808 including a combination of interstate and state and city/county/township bridges, and just 8,949, or 17 percent, are considered SD/FO combined. The Longhorn State has seen a 3-percent improvement in the number of overall SD/FO combined bridges during the past five years, down from 20 percent to the current 17 percent. Breaking down this year’s numbers, 7,480 (14 percent) are SD and 1,469 (3 percent) are FO.
The D.C. Conundrum
It is the nation’s capital that has the highest percentage of combined SD/FO bridges. But the numbers come with some explanations – and perhaps more importantly a disagreement about definitions – from the District of Columbia’s DOT (DDOT).
Of the 199 total interstate and state bridges in the District of Columbia, 122 (61 percent) are SD/FO. (The designation for city/county/township bridges is not applicable because the entire city of Washington, D.C., is treated as a state.) Last year, 123, or 62 percent, of the District’s bridges were considered SD or FO, 7 percent more than in 2009, but down 1 percent of total SD/FO interstate and state bridges from 2010 to 2011.
Availability of funding remains one of the biggest challenges in reducing the rate of SD bridges, notes DDOT’s Don Cooney. Cooney noted this in his survey response to Better Roads in 2010 and repeated this sentiment again in this year’s survey. However, in a follow-up interview with DDOT after the Better Roads Bridge Inventory surveys were tabulated, Ronaldo Nicholson, chief engineer of DDOT, says the percentages don’t always tell the full story. Technically, the bridges in D.C. classified as FO don’t meet current American Association of State Highway and Transportation Officials (AASHTO) standards. “We are talking primarily the national highway system to meet the definition of FO,” Nicholson says. “That definition is in conflict with what the District is trying to do in terms of mobility. Our goal is to provide multimodal transportation.”
One problem is that D.C. is an urban area. Nicholson says DDOT doesn’t have the ability to widen some of the bridges and bring them up to the current AASHTO standards, and for that reason they are being classified as FO. The real estate isn’t available, he says. “I have to decrease lane width to have more access for bikes and pedestrians or for a shared pathway,” Nicholson points out. “So we are meeting our multimodal efforts, but we are still falling technically within the definition of functionally obsolete.”
But reducing the number of FO bridges will always be problematic. “Addressing FO bridges is a bigger problem because of our limited right-of-way,” Nicholson says. “Being functionally obsolete doesn’t mean that the bridges are less safe or functional. They just are not being used the way [for which] they were originally intended. Because we are in an urban environment, we do want people to slow down.”
This is just part of a much larger problem, Nicholson says. He suggests that the Federal Highway Administration (FHWA) and/or AASHTO need to relook at the definition of FO. “As a standing member for the committee of Bridges and Structures for AASHTO,” Nicholson says, “it’s time the states and DOTs relook at the definitions because they give a false perception to the general public about the health of our bridges.”
Nicholson says that, of the 12 percent of SD bridges in D.C., the agency is replacing about half of those. “Seven of our bridges will be coming off the SD list,” he says. “This year, we have already addressed five of those bridges, and two more are planned by the end of the year. We are not Texas or California. We only have 199 bridges. If I take 10 bridges off of the list, it takes the number of SD bridges down significantly.”
The rest of the rankings
Rhode Island is next in the highest percentage of reported SD/FO combined bridges. Taking the No. 2 spot – as it did last year – 371, or 49 percent, of the East Coast state’s total 751 bridges are SD/FO combined. This is a slight drop from last year. In 2010, Rhode Island reported that 417, or 53 percent of 789 total bridges were SD or FO. This year, the state reported that 296, or 49 percent, of its 607 total interstate and state bridges are SD/FO (combined). On a local level, 75 of 144 total city/county/township bridges, that’s 52 percent, are SD/FO combined.
So, there is some improvement from last year when Rhode Island reported 54 percent – 341 – of its 634 total interstate and state bridges in FO or SD condition – and 49 percent – 76 of 155 – of total city/county/township bridges in SD or FO condition.
The Aloha State ranks third for combined overall FO/SD bridges. Last year, Hawaii shared this ranking with Pennsylvania. This year, the State of Hawaii reported that it has 1,176 total bridges, and 449, or 38 percent, are SD/FO (combined). The state now has 773 total interstate and state bridges, and 301 – 39 percent – of them are combined SD/FO. Both of these percentages remain unchanged from 2010. On the municipal level, 37 percent, or 148 of Hawaii’s 403 total city/county/township bridges meet the classification for SD/FO (combined). This is a 1-percent increase from 2010, when 147 of the state’s municipal bridges met this definition.
New York State holds down the fourth-place spot for the highest percentage of total combined SD/FO bridges. At 37 percent, 6,405 of the Empire State’s 17,421 total bridges are considered SD/FO combined. In 2010, 37 percent of the state’s then total 17,405 bridges were SD/FO combined.
Breaking down the numbers, 39 percent, or 3,227 of the states total 8,344 interstate and state bridges are SD/FO (combined). This percentage is also the same as last year when New York had 8,335 total interstate and state bridges, nine fewer than this year, and 3,215 of the bridges met the combined SD/FO classification. In terms of city/county/township bridges, 35 percent, or 3,178 of the total 9,077 city/county/township bridges are SD/FO. Last year, 36 percent – 3,230 – of New York’s total city/county/township bridges were SD/FO (combined).
The fifth-highest percentage of overall combined SD/FO combined bridges is a tie between Connecticut and Pennsylvania, with both states reporting 36 percent of their total bridges in SD/FO condition. Last year, Connecticut was tied with West Virginia for the sixth-highest percentage of overall SD/FO bridges, with 36 percent of both state’s total bridges in SD/FO condition. West Virginia does make one list, though. It has the highest total of city/count/township bridges – 68 percent — in combined SD/FO condition.
In Connecticut, 1,502 of the state’s total 4,184 bridges were considered SD/FO (combined). For Pennsylvania, of the state’s 23,587 total bridges, 8,524 are a SD/FO combined. Despite the same overall SD/FO percentage for total number of bridges, the similarities end there. Connecticut has 37 percent – 1,079 – of its total 2,941 state and interstate bridges considered as a combined SD/FO. When ranking the states by the highest percentage of total interstate/state bridges, Connecticut comes in fourth. Total city/county/township bridges considered SD/FO (combined) are 34 percent, specifically 423 of the 1,243 total city/county/township bridges. These numbers do not put Connecticut on the short list of highest percentage of total city/county/township bridges.
Pennsylvania has 32 percent – 5,335 – of its total 16,729 total interstate and state bridges considered SD/FO. However, nearly one-half – 47 percent – of the 6,858 total city/county/township bridges are SD/FO combined.
Fixes and Wish Lists
If I could change just one thing . . .
It’s a poignant question that we asked agencies: If you could change any one aspect about your department to improve your bridges, what would it be?
Douglas E. Finney, bridge management engineer for the Delaware Department of Transportation, says he’d like to see more of an emphasis placed on maintenance, “to correct more problems before the bridge becomes deficient.” Despite hopes for a greater stress on preventive maintenance, the state has still managed to reduce its number of overall SD/FO bridges (combined). Delaware has reduced its total SD/FO (combined) interstate and state bridges from 171 in 2010 to 167 this year, also bringing its combined total number of SD/FO combined city/county/township bridges from 175 in 2010 to 171 this year.
Georgia Department of Transportation State Bridge Maintenance Engineer Mike Clements would also like to see a stronger maintenance focus. “Add more bridge maintenance positions and increase bridge maintenance funding,” Clements proposes. “Both of these have been decreasing over the last 10 years.” But he also boldly suggests that “bridge maintenance funding should increase and new roadway funding [should be] decreased.”
Washington, D.C.’s Cooney advocates that “a greater emphasis on preventive maintenance” is one of the major overhauls that is needed to the system of planning, building and maintaining bridges in the United States at the federal, state and local levels.
Bridge engineers at the Virginia Department of Transportation (VDOT) agree. Not only is “more funding needed at national, state and local levels to address bridge needs,” but greater emphasis needs to be placed on system preservation and preventive maintenance, “to maintain structures in good condition and to slow the downward trend of structures moving into the deficient category, while at the same time addressing the deficient bridge population,” say Claude Napier and Adam Matteo, VDOT engineers responsible for bridge safety inspection and bridge maintenance, respectively.
Matteo and Napier suggest that states use high-performance concrete, high-performance steel, corrosion-resistant reinforcing steel and other high-performance material to “extend the service life of new structures as well as those that are being rehabilitated.” They also say agencies should consider jointless construction for new construction of integral or semi-integral and continuous spans, as well as the elimination of deck joints on existing bridges. “Leaking joints are a major cause of deterioration to superstructure and substructure elements beneath leaking deck expansion joints,” Napier and Matteo explain. “The use of accelerated bridge construction techniques and prefabricated bridge elements should be considered and used to minimize the impact on the traveling public.”
Additionally, they say, a systematic approach should be used for addressing bridge needs through preventive maintenance, restorative maintenance, rehabilitation and replacement, which are funded through maintenance funding and dedicated bridge funding. “A new emphasis is [also] being placed on rural bridges and culverts using Stimulus funds,” say Napier and Matteo.
Harvey L. Coffman, bridge preservation engineer for the Washington (State) Department of Transportation, proposes that the “use of preventive maintenance funds should be allowed for structurally deficient bridges.” W. Kyle Stollings, director of West Virginia Department of Transportation’s Maintenance Division, adds that complete designer control of quality assurance/quality control and serviceability is needed in contract documents. “Serviceability/lifecycle costs [are] compromised due to first cost issues.”
Alex Bardow, bridge engineer for the Massachusetts Department of Transportation, says that “streamlining environmental process, public participation and ensuring dedicated bridge preservation funding” is also greatly needed.
When it comes to financing and repairing/replacing bridges in the United States, a one-size-fits-all approach shouldn’t be used, says South Dakota DOT’s Olson. “I live in a rural state, and sometimes we’re just following procedures because it’s regulatory everywhere.” This means, he says, that just because the federal government adheres to a certain procedure, it wants everywhere else to follow it, but it doesn’t always make sense financially or isn’t necessary. The funds used to follow the procedures could be better spent elsewhere, such as repairing or replacing bridges, Olson says.
John Clark, senior bridge maintenance and repair engineer for the Florida Department of Transportation, calls situations such as Olson’s “unfunded mandates.” Clark says the primary responsibility at the federal level is the interstate system. However, because funding starts at this level and because of organizations such as AASHTO, sometimes mandates trickle down to the states and even local bridges off the interstate system.
“They hold captive funding for the interstate by saying, ‘We’d like you to do something this way,’ but it’s essentially an unfunded mandate,” Clark explains. “We then have to do certain things we weren’t expecting to do and we’re not being funded for it. Their [federal] vision is from a national standpoint, which may or may not align with the state’s vision for the transportation system.” When the visions do differ, Clark says, “it can cause us to spend money that we think is not helpful or is unnecessary. As long as the DOT management accepts it, though, it’s what we go along with. But it is something I would look at.”
Keeping this in mind, it’s notable that Florida makes the short list of states with the lowest percentage (No. 7, 17 percent) of SD/FO combined bridges. “We have a statute in Florida that if a bridge becomes structurally deficient or ‘posted,’ it must be repaired or replaced within six years to remove the deficiency,” Clark points out. “We don’t have a lot of mandates, but that is one of them. That is one reason we have a low number of SD bridges. The government has decided that transportation is a key element of our economy, so it puts resources there.”
Jeff C. Vigil, P.E., state bridge management engineer for New Mexico’s Department of Transportation’s Bridge Maintenance Unit, says that states need “stable funding sources” to remove the uncertainty that is currently dealt with when planning for the future. At his department, design and construction funding levels for FY 2011 were up slightly to about $500 million. “This amount is expected to drop by about 30 percent for FY 2012,” he says.
Utah’s Department of Transportation (UDOT) says it hopes to be able to lower its rate of deficient bridges in the coming year, but it all depends on funding. To what extent will insufficient funding restrict important work for UDOT in the coming year? “This remains to be seen,” says Daniel Page, UDOT bridge design and operations manager.
Bruce Johnson, bridge engineer with the Oregon Department of Transportation, believes that insufficient funding will restrict important work next year to “a great extent.” Although the agency expects to lower its rate of SD/FO bridges in the coming year through a bonding program, the bridge program “is decreasing due to a reduction in funding.”
The Kansas Department of Transportation also expects to lower its rate of deficient bridges in the coming year, “through continued funding of the T-works program [a comprehensive transportation bill that was passed in the 2010 state legislative session] and a focus on preservation of our current system,” says Calvin Reed, bridge management engineer for KDOT Bureau of Transportation Planning. “State funding is fairly secure, [but] federal funding is up in the air. If federal funding drops, some work will have to be postponed.” Modifying the current system of receiving federal funding would help with this problem. “The sufficiency formula is outdated.”
The Mississippi Department of Transportation’s bridge replacement program has benefited from an infusion of 100-percent state funds, which the agency says will help it reduce SD/FO bridges. “This has allowed us to continue to lower the number of deficient bridges,” MissDOT’s Carr explains. That being said, Carr notes “once the temporary infusion of state funds has been expended, we will once again only have our normal level of federal bridge replacement funds.” Right now, Carr says, “the most urgent need is increasing the level of federal bridge replacement funding. Federal bridge replacement funding has remained generally the same for over 20 years. In that same time, construction costs have more than doubled. Increased federal funding is imperative.”
Q&A:
Describe the past 12 months for your department in terms of work and funding.
“Work needs have increased while funding has decreased.” –Eric J. Christie, assistant state maintenance engineer for bridges, Alabama Department of Transportation
“We have performed a significant amount of work on culverts that are too small to be included in the [Better Roads] National Bridge Inventory.”—Douglas E. Finney, bridge manager engineer, Delaware Department of Transportation
Q&A:
To what extent will insufficient funding restrict important work in the coming year?
“Federal funding uncertainties may result in withholding projects.” –Harvey L. Coffman, P.E., bridge preservation engineer, Washington (State) Department of Transportation
“Projects [may be] deferred due to flat revenues.” – W. Kyle Stollings, director of Maintenance Division, West Virginia Department of Transportation
What We Do
The Bridge Inventory is an annual survey begun in 1979. Bridge engineers from each state and Washington, D.C., are sent a survey with both qualitative and quantitative questions.
 How deficient and obsolete bridges break out in 2011 -- States and the District of Columbia have provided separate counts for the latest numbers on the breakdown of their structurally deficient (SD) and functionally obsolete (FO) bridges. For the FHWA’s explanation of what makes a bridge structurally deficient and how a bridge becomes functionally obsolete, go to http://www.fhwa.dot.gov/policy/2008cpr/chap3.htm#7. Better Roads’ editorial staff would like to thank all the state highway engineers for their continuing cooperation and special effort to provide current data. The data was collected through November 2011.
Q&A:
Do environmental restrictions affect how well you can replace or repair deficient bridges?
Yes
Jeff C. Vigil, P.E., state bridge management engineer, New Mexico Department of Transportation: “Yes. Environmental restrictions and restrictions due to historical classification of bridges cause delays to our bridge projects.”
Benjamin W. Foster, assistant bridge maintenance engineer, Maine Department of Transportation: “Yes. [It] increases construction costs.”
Mike Clements, state bridge engineer, Georgia Department of Transportation: “Yes. Environmental documents increase the time from concept to letting.”
Thomas Martin, bridge maintenance engineer of Minnesota Bridges and Structures: “Yes. Project time span and costs are increased due to environmental restrictions and compliance.”
Bruce Johnson, bridge engineer, Oregon Department of Transportation: “Yes. [It] adds cost and delays.”
Steve Andersen, Nebraska Department of Roads, Bridge Division: “Yes. The environmental process has become so lengthy, it takes three years to get a project through to a letting.”
Michael B. Johnson, office chief, California Department of Transportation: “Yes. Some permits are difficult to get in a timely manner.”
NO
Claude Napier, bridge safety inspection, Virginia Department of Transportation (VDOT), and Adam Matteo, bridge maintenance, VDOT: “No. We are able to work through environmental challenges (in-stream restrictions, endangered species, wetlands and any hazard materials) through proper planning and early coordination. Environmental restrictions may affect project durations, but does not affect the quality of the project.”
Charles P. Brand, bridge engineer, Arkansas State Highway Transportation Department: “No.”
Eric J. Christie, assistant maintenance engineer – bridges, Alabama Department of Transportation: “No. Not generally, but [it’s] becoming more of an issue.”
Travis McDaniel, bridge engineer, Wisconsin Department of Transportation: “No.”
Ray Mumphrey, bridge engineer manager, Louisiana Department of Transportation; ‘No. [It restricts] progress.”


