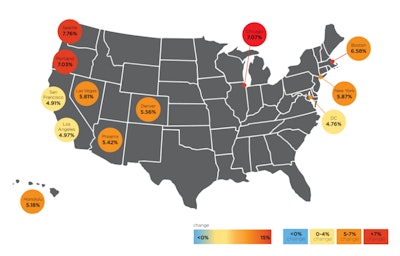
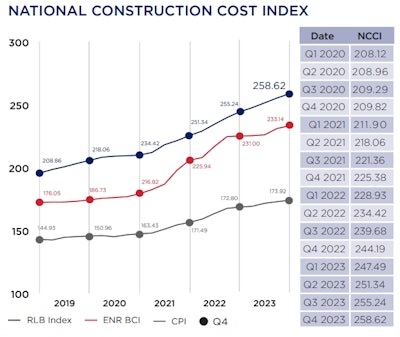
Construction costs are up 1.53% from Q3 and to 5.28% year-over-year, according to the latest Rider Levett Bucknall (RLB) quarterly cost report.
Boston, Chicago, Honolulu, Portland, Seattle, and Washington, D.C., saw the greatest increases over the national average this quarter, while Denver, Las Vegas, Los Angeles, New York, Phoenix, and San Francisco experienced gains that were less than the national average.
 RLB
RLB
“While there are a lot of positive indicators for the industry right now, including consumer confidence, moderating inflation, and low unemployment, there are still enough other indicators showing us that the economic uncertainty hasn’t become any clearer. The newest numbers on the ABI, the chronic workforce challenges, and potential soft recession still feed the uncertainty and a potential slowdown for 2024,” said Paul Brussow, president of RLB North America.
[Watch: Slowdown in 2024? – Why AGC’s Economist Sees Varied Growth for Construction]
Key Indicators and Trends
Sector Winners and Losers
Construction-put-in-place during October 2023 was $2,027.1 billion, 0.6% above the revised September 2023 estimate of $2,014.7 billion, and 10.7% above the October 2022 estimate of $1,830.5 billion, according to the U.S. Department of Commerce. Infrastructure projects helped drive that growth, while commercial construction declined 1.5%, and multifamily housing has come down from record highs.
Architectural Billings Soften
The Architectural Billings Index (ABI) dropped to 44.3, the third month in a row of significant decreases, suggesting implications of that downward trend may be seen later in the year. Billings were soft across the country, with firms in the West and Northeast seeing the softest conditions.
“Interest rates and financing constraints have slowed construction starts over the last quarter. We’ll want to keep an eye on interest rates as we start 2024 and the potential for continued slowing of construction starts,” said Brussow. “While many projects will proceed, we anticipate seeing an influx of cost-cutting measures as a response to inflation, so they can still move forward.”
Labor Shortages Persist
The most recent construction job opening numbers hit a record 450,000 and the unemployment rate is at 3.8 percent, down slightly from 3.4 percent in the same period last year.
“Labor continues to be shrouded in a dark cloud,” added Brussow. “However, akin to finance costs and interest rates, labor shortages are not prohibiting construction projects from moving forward.”
[Related Content: Construction Job Openings Hit Highest Level Since December 2022]
Dodge Momentum Index vs. RLB National Construction Cost Index
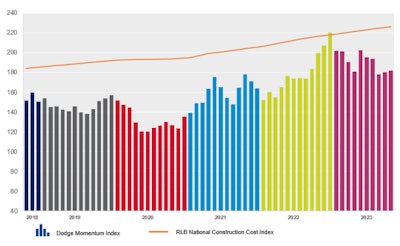
The Dodge Momentum Index (DMI), a monthly measure of nonresidential building projects in planning that has been shown to lead construction spending for non-residential buildings for a full year, rose in October thanks to increased commercial activity. This marked the second consecutive of growth following three months of declines.
At the same time, RLB’s National Construction Cost Index (NCCI) rose 5.9 percent from 244.2 to 258.6, a downward trend of 8.3% from a year earlier. The NCCI (marked by the orange line above the bar in the chart below) represents the average escalation of costs across 12 U.S. cities, representing the hypothetical change in bid pricing across cities measured that quarter.
Many $100+ million nonresidential projects entered the planning stages in October. Despite high interest rates, supply chain bottlenecks, and stricter lending standards continuing to impact the commercial segment, RLB says the DMI indicates that overall planning activity remains strong, which will support construction spending over the next 12 to 18 months.
 RLB
RLB
 RLB
RLB


