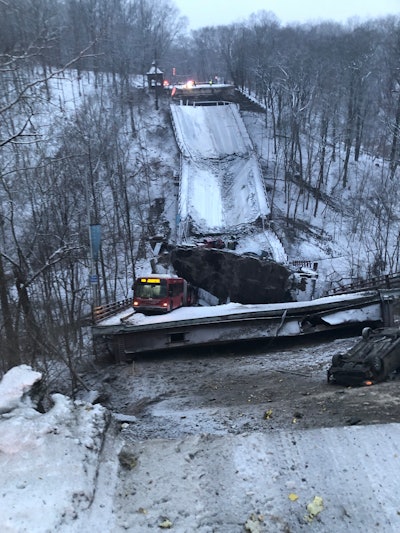
The site of the January 28 collapse of the Fern Hollow Bridge in Pittsburgh, involving a transit bus and five passenger vehicles. The bridge had been rated in poor condition since 2011. A new bridge is being built to replace it.
National Transportation Safety Board
This year’s Better Roads Bridge Inventory presents a mixed bag of the nation’s crossings.
Bridges rated “fair” continue to make up the highest percentage of the nation’s inventory, according to data from the Federal Highway Administration. It’s been a growing category over the years as many states lose ground on maintaining their bridges, seeing them slip out of good condition. This year, the number of fair bridges rose by 6,130.
On a slightly brighter note, the number of "good" bridges increased by 1,432, reversing last year’s drop in the category.
Though good bridges increased, so did the number of "poor" bridges, up 194 from 2021.
Those changes, however, didn’t move the needle much overall, as the percentages of bridges rated good, fair and poor remained relatively steady for the U.S. in 2022.
Welcome to Equipment World’s 2022 Better Roads Bridge Inventory. What follows are some snapshots from data compiled from FHWA Bridge Condition reports, submitted by departments of transportation for all 50 states and the District of Columbia as of June 15, 2022. We rank the top and bottom states in various categories using that data. At the end of the article, we also provide a detailed look at overall conditions of the bridges in each state, so you can see how your state stacks up.
Bridge condition ratings
Overall percentages of U.S. bridge ratings for 2022.Equipment WorldBefore we delve into the state bridge rankings, let’s take a look at what the ratings mean.
The Federal Highway Administration asks states to rate bridges that are 20 feet or longer as “Good,” “Fair” or “Poor.”
GOOD – Bridges in this category range from excellent to some minor problems.
FAIR – Ranging from bridges with structural elements showing some minor deterioration, to bridges in which all primary structural elements are sound but may have minor section loss, cracking, spalling or scour; and may include minor erosion on bridge piers.
POOR – There are five categories of poor bridges:
Poor – Advanced corrosion, deterioration, cracking or chipping. Also significant erosion of concrete bridge condition piers.
Serious – Loss of section, deterioration, spalling or scour have seriously affected primary structural components. Local failures are possible. Fatigue cracks in steel or shear cracks in concrete may be present.
Critical – Advanced deterioration of primary structural elements. Fatigue cracks in steel or shear cracks in concrete may be present or scour may have removed substructure support. Unless closely monitored, it may be necessary to close the bridge until corrective action is taken.
Imminent Failure – Major deterioration or section loss present in critical structural components, or obvious loss present in critical structural components, or obvious vertical or horizontal movement affecting structural stability. Bridge is closed to traffic, but corrective action may be sufficient to put the bridge back in light service.
Failed condition – Bridge is out of service and beyond corrective action.
A breakdown of national bridge ratings, comparing the 2021 Better Roads Bridge Inventory to the 2022 inventory.Equipment World
Ranking the states
All data come from the Federal Highway Administration’s online National Bridge Inventory as reported by June 15, 2022. It was compared with data from last year’s Better Roads Bridge Inventory.
States with the lowest percentage of poor rated bridges
Arizona – The state continues to hold the top spot for the lowest percentage of poor bridges, but it saw an increase from .8% in 2021 to 1.26% this year.
Texas – It moves up to second place from third last year after continuing for the third year to reduce its percentage of poor bridges. This year it reported 1.39% of its bridges in poor condition, down from 1.42% in 2021 and 1.5% in 2020.
Nevada – It moves down a notch to third place from second, though its percentage dropped slightly by .01% to 1.4%.
Delaware – The state saw a .09% increase this year over last year in bridges rated poor, yet maintained fourth place.
District of Columbia – The district moves up from eighth place last year with a percentage of 1.61%. That’s a drop from 2.85%.
States with the highest percentage of poor rated bridges
West Virginia – The state’s percentage of poor bridge dropped slightly from 20.22% to 19.97%, but not enough to move it out of last place.
Iowa – At 19.32%, Iowa saw an increase in percentage over last year’s 18.87%.
South Dakota – Same spot as last year, though its percentage dropped from 17.43% to 16.89%.
Rhode Island – The state continues its progress out of the basement where it resided in 2019 and many years before that. It reported 16.58% this year, a drop from last year’s 17.33%. Future progress, however, could be uncertain as a major source of funding the state’s bridge program – highway tolls on tractor trailers – was ruled unconstitutional by a federal judge in September. The state Department of Transportation has filed an appeal.
Maine – The state drops from 46 to 47 with 14.17% of its bridges rated poor, up from 12.58%.
States with the highest percentage of bridges rated good
Georgia – The state moved up from fourth place to first in 2021 and hasn’t looked back. This year it posts nearly three-fourths of its bridges in good condition.
Arizona – The state with the lowest percentage of poor bridges moves into second place for highest percentage of good bridges, at 62.78%. That’s up from third place last year when it reported 64.46%.
Florida – The Sunshine State drops again this year, moving from first in 2020 to second in 2021. It’s now at third place at 61.78% – a drop from 65.29%.
Ohio – The Buckeye State is holding steady at fourth place for the second year in a row, with a 60.87%.
Minnesota – The state moves up from sixth place to fifth with 57.84% of its bridges in good condition. The move up, however, appears to be more from Mississippi’s good bridges dropping from 59.26% to 57.56%, moving it out of fifth and into sixth. Minnesota’s percentage of good bridges dropped by 1.62 percentage points.
States with the lowest percentage of bridges rated good
Rhode Island – 21.43%
West Virginia – 23.38%
Hawaii – 24.13%
Massachusetts – 25.32%
New Jersey – 26.32%
States with highest percentage of bridges rated fair
Utah – 70.06%
Hawaii – 69.58%
New Jersey – 66.99%
District of Columbia – 66.94%
Massachusetts – 66.22%
States with lowest percentage of bridges rated fair
Georgia – 23.29%
Ohio – 34.06%
Florida – 34.65%
Mississippi – 35.9%
Arizona – 35.97%
States with lowest percentage of bridge deck area rated poor
Utah – .78%
Georgia – 1%
Nevada – 1.04%
Arizona – 1.15%
Texas – 1.25%
States with highest percentage of bridge deck area rated poor
Rhode Island – 17.12%
West Virginia – 15%
Illinois – 11.96%
Massachusetts – 10.77%
New York – 10.71%
Partner Insights
Information to advance your business from industry suppliers
Careersingear.com is the go-to platform for the Trucking industry. Don’t just find the job you need; find the job you want with the company that wants you!

 Overall percentages of U.S. bridge ratings for 2022.Equipment World
 A breakdown of national bridge ratings, comparing the 2021 Better Roads Bridge Inventory to the 2022 inventory.Equipment World
 A breakdown of national bridge ratings, comparing the 2021 Better Roads Bridge Inventory to the 2022 inventory.Equipment World


 Equipment World
 Equipment World