How new technology is changing in the quest for smooth pavements
 On S.H. 130, Central Texas Toll Road, Roadtec MTVs (Shuttle Buggies) feed pavers with skis with sensors providing input for automatic-leveling controls.
Surveys consistently show that smoothness is the No. 1 criterion by which road users judge pavements. Other studies have found pavements that are built smooth stay smoother longer and provide a longer life.
This makes it appear that pursuing smoothness from the start is a cost-effective proposition. State Departments of Transportation (DOTs) routinely employ smoothness specifications in their regulations and are basing contractor payment incentives or disincentives on achieved pavement smoothness.
But the methods used to judge pavement smoothness as part of acceptance testing for new or reconstructed pavements are growing more refined. Also, the equipment used to obtain smooth pavements during construction is improving as digital and laser technology develops new products.
For asphalt pavements, smoothness is just one piece of the quality-assurance puzzle (see Quality Management: How to Handle Materials, from the Source to the Site, in Better Roads’ September issue, pp. 4-8). Other quality characteristics for acceptance measurement include asphalt mix properties such as asphalt content, gradation, volumetrics and as-built density. Portland cement concrete (PCC) pavement faces similar scrutiny.
Smoothness brings benefits
Pavement smoothness is more than just pleasing drivers with the sensation of driving on pavements that aren’t rough; it’s one of three pavement characteristics that reduce fuel consumption, as described by the 2010 publication by the Asphalt Pavement Alliance (APA), Smoothness Matters.
The three pavement characteristics are tire/pavement rolling resistance, pavement stiffness and pavement smoothness.
According to APA, tire/pavement rolling resistance is the loss of a vehicle’s energy due to contact between the tires and the pavement. The loss of energy due to rolling resistance is small, about 15 to 20 percent, compared to other forces such as wind resistance. It’s estimated that a 5- to 7-percent reduction in rolling resistance – typically attributed to tire air pressure or baldness – only increases automobile fuel efficiency by less than 1 percent.


Pavement stiffness’s impact on fuel efficiency is minimal, APA says in Smoothness Matters. Stiffness, an indicator of strength, accounts for between 0.005 percent to 0.5 percent difference in fuel consumption, depending on the vehicle type (e.g., automobile vs. tractor-trailer).
Pavement smoothness is more significant than the other factors in boosting fuel economy, at 5 percent or better, APA says. Pavement smoothness affects rolling resistance by influencing friction between the tire and the pavement.
“Some experts estimate it is possible to reduce fuel consumption by as much as 10 percent by rehabilitating the roughest pavements,” APA notes, adding driving on rough roads costs the nation’s motorists $65 billion annually in extra vehicle operating costs, according to The Road Information Program (TRIP).
Decline of the profilograph
A variety of devices has been used to measure pavement smoothness. The most familiar is the California profilograph, but now inertial profilers and non-contact lightweight profiling devices are supplanting the former.
“Profilographs have successfully been used for construction quality control on thousands of miles of pavements during the past several decades,” says the Federal Highway Administration’s (FHWA) Joseph Budras, P.E.
The two most commonly used smoothness indexes are the International Roughness Index (IRI) and Profilograph Index (PrI or PI). With the early popularity of the profilograph, the profile index became a standard index for smoothness measurement in construction specifications, Budras says.
Profilographs are relatively inexpensive, simple to operate and maintain and provide a trace of pavement surface that users can easily understand. However, because of its wheel linkage, it cannot be used for high-speed network pavement smoothness data collection.
In contrast, the vehicle-mounted inertial profiler measures pavement smoothness while driving at highway speeds. The California profilograph it replaces is a non-motorized piece of equipment that moves at walking speed and exposes workers to traffic and construction hazards.
To make the profilograph more useful, the “blanking band” was instituted, which is a band that is placed over a profilograph trace to “mask” the portion of the trace that is not counted as roughness.
“PrI is determined by counting the number of scallops in the profile trace that fall outside of a specified blanking band,” notes Federal Highway Administration (FHWA) engineering consultant Transtec Group. “0.2-inch (5 mm) and 0-inch (0 mm) blanking bands are most commonly used in the United States, although a few states use a 0.1-inch (2.5 mm) blanking band as well. PrI is sometimes called Profile Index (PI), but the former is more specific.”
For a long time, the profilograph has been used to measure the longitudinal profile of a pavement. Its principal use has been for the construction control of pavements. But because its front and rear wheels are in contact with the pavement surface, the profilograph can’t accurately measure the pavement profile, and the profile index doesn’t reflect the riding comfort of a roadway.
“No claim is made that the roughness or riding quality of a pavement is directly or completely reflected by the profile index,” said the profilograph’s inventor, Francis N. Hveem, in 1960. “It should again be emphasized that, strictly speaking, the devices reported herein do not furnish a direct index to ‘riding qualities’.” Hveem is a titan of the asphalt industry and is enshrined in the National Asphalt Pavement Association’s (NAPA) Hall of Fame.
Enter inertial profilers
While the California profilograph was used extensively after the 1960s, it’s being supplanted by the inertial profiler, which can measure and record road surface profiles for network use at speeds between 10 and 70 mph. This means use of the PrI is declining in favor of the more nuanced IRI.
“Many agencies are increasingly turning to inertial profilers as the most reliable instrument for construction acceptance testing and verifying pavement smoothness,” says the National Highway Institute (NHI) in its course description for FHWA-NHI-131100, Pavement Smoothness: Use of Inertial Profiler Measurements for Construction Quality Control.
The inertial profiler, also called a profilometer, measures and computes the longitudinal profile of the pavement through the creation of an inertial reference by using accelerometers placed on the body of a measuring vehicle. Relative displacement between the accelerometers and the pavement surface is measured with a non-contact light or acoustic measuring system mounted with the accelerometer on the vehicle body.
A new generation of lightweight non-contact profilers has emerged for construction quality control and quality-acceptance purposes. Smaller and lighter than network-level profilers, they provide the benefit of use immediately after asphalt placement and much sooner than would be possible with the network level devices on new PCC pavements.
A typical lightweight profiler features state-of-the-art measuring equipment mounted on an all-terrain vehicle. A non-contact sensor collects data as the profiler travels the pavement surface. The raw data are stored in an on-board computer for processing.
These data are used to calculate an IRI of a pavement. “The International Roughness Index (IRI) is a scale for roughness based on the simulated response of a generic motor vehicle to the roughness in a single wheel path of the road surface,” according to the Minnesota Department of Transportation (DOT) at its Bituminous Smoothness Training workshop in 2007. “Its true value is determined by obtaining a suitably accurate measurement of the profile of the road, processing it through an algorithm that simulates the way a reference vehicle would respond to the roughness inputs and accumulating the suspension travel It is normally reported in inches/mile or meters/kilometer.”
“IRI can be determined using measurements from any valid profiler (inertial profiler, inclinometer-based device, rod-and-level, etc.) which generates a profile trace showing the ‘true’ shape of the pavement surface,” says Transtec, a pavement engineering and design firm. “This pavement profile is fed into an algorithm that determines the IRI value for the pavement. IRI can also be crudely measured by response-type systems using correlation to a reference profiler.”
However, the IRI is attuned into the wavelengths that cause humans to feel discomfort (body bounce and axle hop). IRI can be calculated from any accurately measured pavement profile but that rules out calculation of IRI from a profilograph trace.
States make the change
Figures 1 and 2 show the status of adoption of IRI versus PrI among state DOTs as of a few years ago, for bituminous pavements (Fig. 1) and portland cement concrete pavements (Fig. 2).
 Specified pavement profiling indices by state, hot-mix asphalt pavements
Minnesota began its switch from PrI to IRI in 2007, with a new specification for measurement and payment of surface smoothness on new PCC pavement construction. The report reviewed smoothness specs for PCC pavements in other states and analyzed the effect on smoothness incentives by comparing the existing PrI spec with the proposed IRI specification.
The Florida DOT annually evaluates more than 40,000 lane miles of pavement across the state, it reported in December 2012. The work entails evaluating the surface condition of the pavement in terms of roughness, cracking and rutting at the network level as well as at the project level.
 Specified pavement profiling indicies by state, PCC pavements
“Although various roughness indices exist, the International Roughness Index (IRI) and Ride Number (RN) are the primary ones used in the United States,” reports Precision of High-Speed Inertial Profilers for Asphalt Pavement Smoothness Measurement, by Alexander Mraz, Hyung S. Lee, Charles Holzschuher, Abdenour Nazef and Bouzid Choubane of the Florida State Materials Office.
The IRI summarizes the pavement roughness in terms of the theoretical response of a vehicle, they say, while the RN estimates user perception of ride comfort and provides a prediction of a mean panel rating from pavement profile.
“It is an index without any units and can range from 0.0 to 5.0, where 5.0 represents a perfect ride and 0.0 corresponds to a virtually impassable road,” they say. “Currently, the Florida Department of Transportation (FDOT) collects the pavement profiles using high-speed inertial profilers (HSIP) as standardized in ASTM E 950 and analyzes pavement roughness using RN, with the near future objective of implementing IRI for project smoothness acceptance on the state highway system.”
The state was able to confirm repeatability – thus reliability – of the HSIP in terms of IRI and RN for determining the ride quality, or smoothness, of the newly constructed, overlaid or rehabilitated flexible pavements.
Even California – where the profilograph was developed – is switching to IRI rating of pavement smoothness. This year, Caltrans opened the Golden State’s first certification and calibration site for inertial profiler devices and technicians, part of the department’s move to update its pavement smoothness specifications to accommodate new measurement technology.
 Within ProVAL, after data input, users may select or unselect the desired pavement profiles by their corresponding checkboxes. Selected profiles will be displayed on the chart. From this point on, you can view the profile, manipulate the data, perform analyses, and produce reports
In February 2013, Caltrans published a new hot-mix asphalt (HMA) spec that requires all pavement projects use the inertial profiler for measuring pavement smoothness in lieu of the California profilograph. A similar spec for concrete pavements was published earlier.
“This new specification and certification site represents a quantum leap forward in the department’s commitment to pavement smoothness,” says Peter Vacura, head of asphalt pavements for the Caltrans Pavement Program. “These new devices will help transportation agencies and contractors build smoother- and safer-riding pavements for motorists, a safer working environment for highway workers and help improve gas mileage and cut down on GHG emissions.”
ProVAL eases pavement profiling
Road agencies have an easier time putting all of this data together because of ProVAL, an engineering software application that allows users to view and analyze pavement profiles in many different ways.
Developed by the Transtec Group under the aegis of the FHWA and the Long Term Pavement Performance (LTPP) program, ProVAL 3.4 – for Profile Viewing and Analysis – permits users to import profiles from various file formats and save them in a pavement profile standard file type. Entire projects’ analyses can be saved, which preserves user information and analysis inputs. After analyses have been performed, the user can print a report of the original profiles and the results of any analyses performed.
The profile data may be manipulated in many aspects, including cropping and filtering. Ride statistics such as the IRI and half-car roughness Index (HRI), mean roughness index (MRI) and ride number (RN) may be entered. The report types include full, fixed interval, and continuous; wavelength or frequency contents of profiles may be entered; and profilograph traces can be simulated.
You can download the latest ProVAL from roadprofile.com, where supporting information is available.
Attaining smoothness: Every job is different
With the movement toward more precise measurements of smoothness, the burden is on the contractor to meet smoothness specifications. Fortunately, equipment and techniques exist to make attaining specs and smoothness incentives easier.
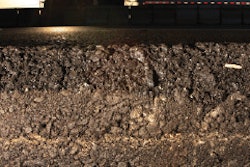
Careful milling provides the foundation for smooth asphalt overlay. So-called “fine milling” now is getting much more attention as thin surfacings and overlays become more popular, but it applies to conventional asphalt lifts as well.
While thin surfacings provide durable driving surfaces, their thinness makes them vulnerable to variations in the pavement substrate on which they are placed. The evenness and smoothness of these thin surface treatments will depend mostly on the smoothness of the prepared surface, but that can be ensured by cold milling of the existing, worn surface with a fine-tooth drum.
 Elements of Gomaco Smoothness Indicator (GSI)
“With a conventional drum and relative to ground speed, the ‘peaks-and-valleys’ patterns will be relatively high and deep,” says Jeff Wiley, senior vice president, Wirtgen America. “If you are not placing a lift that’s thicker than 1- to 1-1/4-inches, the rough surface can reflect through to the paved surface. But with 5/16-inch bit spacing (or less) – the definition of a fine-toothed drum – an owner or contractor can minimize the potential reflection of the peaks and valleys through the thin lift surface.”
Cutter drums are continually undergoing analysis and improvement to enhance their performance in their abrasive environments. For example, in spring 2009, Roadtec introduced improvements to its line of cold planer cutter drums, including the redesign of the drum end ring configuration for better match-cutting and increased tool life, the impact angle of all of the tools on the drum was adjusted to optimize the life of the consumable bit.
The “lacing” pattern was adjusted to provide a better texture on the milled surface, as well as a more balanced impact when the cutting tools strike the surface.
The variety of grade and slope controls available to operators of cold mills is wide, but they all assist operators in achieving smooth, predictable cuts.
“Every job is different, and the operator today has the opportunity to select the type of grade control system he wants to use,” Wiley says. “It could be a laser system, running off stringline, GPS, dual-grade, grade-and-slope, averaging, averaging with three sensor heads or seven sensor heads. The owner can have anything and everything he or she needs to perform the most precise job that he needs to.”
Speed of forward movement will impact the quality and evenness of the cut. “As long as the bid is all about production – that’s the way all milling contractors make money these days, by the square yard and tonnage that they achieve in a day – the machine has to run at a high rate of speed,” Wiley said. “But very high speeds don’t necessarily mean a high-quality cut. It’s better for a milling contractor to run at a somewhat slower speed, but at a steady pace, 40 to 45 minutes an hour, and he still will have achieved the production he needs at the end of the day, but with a superior pattern.”
The faster you go, the worse the pattern gets. The rougher the texture, the harder it will be to maintain smooth grade with the milling machine, he says.
Paver operations
The next critical point in attaining smooth asphalt pavements is the paving process. The theme here is don’t stop.
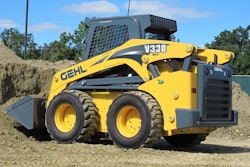
Begin by isolating the paver from the supply truck; that’s done via religious use of the Roadtec material transfer vehicle (MTV), which keeps hot mix hot while fighting mix segregation and keeps the paver moving forward without the roughness-inducing jolt of truck against paver. This also means saying goodbye to wheel locks, which bind the front of the paver to the rear wheels of the dump truck.
The Asphalt Institute recommends operating the paver speed and feed gates to keep the augers turning 85 percent of the time, keeping forward motion at least 75 percent of the time and maintaining feed augers with proper head and uniform flow of material to the screed.
Once the paver is in motion, it should stay in motion. Then, automatic screed and grade controls using averaging skis will attain exceptional smoothness in the final pavement, so long as compaction is executed correctly.
Late last season, a pair of high-performance pavers were attaining astonishingly smooth placements of hot mix asphalt on segments 5 and 6 of the new State Highway 130 central Texas toll route south of Austin. Two identical pavers were used in echelon to get a hot joint between the two lanes. The hot joint was specified by the owner and the contractor was paving 40 feet wide, with a 22-foot-pull outside and an 18-foot pull on the inside, including a 6-foot inside shoulder and 10-foot outside shoulder.
The pavers were getting extremely smooth placements, says Jerry Jaeger, field manager for Industrial Asphalt, Austin. Specs required an IRI of 60 or below, but the pavers were well below that threshold. “I don’t think we would have got it with other pavers, but these were getting 20s and 30s IRI readings,” Jaeger said. “I’ve seen that before with quarter-mile stretches, but we’re at 41 miles of continuous overlay. It’s exceptional.”
“The IRIs we have been getting are unbelievable,” says Brian Swift, superintendent for Industrial Asphalt. “We’re getting anywhere from 26 to a 37, and the requirement is 60.” Smoothness was being augmented by the paver automatic control system utilizing 50-foot skis. Two skis were used on the 18-foot paver and one on the 22-foot paver.
At the same time, work was proceeding on the Circuit of the Americas Formula 1 race track just outside Austin where approximately 80,000 tons of HMA was placed on the track. Nearly 10,500 tons of surface mix were placed on the wearing course alone. When the paved run-offs and verges were included, a total of 21,000 tons of critical wearing course were placed.
“There are many differences between building a Formula 1 track and a high-level interstate-type highway,” Byrum says. “No. 1, the surface mixture, is a high-performance friction course with a high level of skid resistance, and asphalt cement is present at 6.5 percent of the mix. At PG 82-22, the liquid asphalt was highly modified with SBS polymer. It could be considered a Superpave mix, similar to a stone-matrix asphalt (SMA), with high binder content and gap-graded aggregate, providing rock-on-rock contact with minimal fines. It must be durable and skid-resistant.”
The smoothness spec was the toughest aspect of the job, he adds. “More than anything, the flatness spec is what made this a huge challenge,” Byrum says. “The surface course has a tight specification for smoothness, 2 millimeters over 4 meters [0.08 inches over 13 feet].”
Meeting those specs on the top layer meant each lift below also had to be super-smooth. The 3.1-in.-deep base course has a PG 64-22 binder with a smoothness spec of 4 mm over 4 meters (0.18 in. over 13 ft.), while the 2-inch-deep intermediate “binder” lift in the middle has PG 76-22 liquid asphalt, with a little SBS modifer in it, and a smoothness spec of 3 millimeters over 4 meters (0.11 inch over 13 feet).
While the base course was placed by a single paver, the binger and wearing courses were placed by pavers in echelon. “We had a V-shaped paving operation in the middle,” Byrum says. “This had to be a continous process, and we could not stop throughout the pass.”
Smoothness for concrete
Past concrete pavements have been criticized for their inherent roughness, but modern-day continuously reinforced concrete pavements (CRCPs) can be constructed with exceptional smoothness, in no little part due to their lack of expansion joints.
The Gomaco Smoothness Indicator (GSI) is a new tool that will help PCC pavements build even smoother. The GSI, operating either as paver-mounted, work bridge-mounted or as an independent GSI machine, has the ability to monitor and report smoothness readings to the contractor instantaneously. As such, it’s a powerful quality-assurance tool.
The GSI has the ability to read up to eight traces in a single pass, directly behind the paver, Gomaco says. The real-time information collected creates the GSI number or an instant rolling average of the surface smoothness readings.
The GSI number is relative to the IRI number, but created within a much shorter paved distance; that distance can be adjusted by the operator. Along with the GSI number, two other indexes are also calculated continually, the PI or profile index, which is based on the California profilograph, and the IRI.
The information can be exported as an *.erd file. The indices are derived from the true profile of the surface, determined by the data collected. These indexes are viewed and monitored on the GSI’s seven-inch diagonal, touch-screen monitor. The touch screen, with adjustable mount, allows optimum viewing. The on-the-go surface smoothness information includes station and footage documentation for later reference of bump and smoothness locations.
The GSI’s bump alarm can be set with project parameters. If a bump, localized roughness occurs during paving that is out of parameter, a bump warning is displayed and the bump’s station location is marked on the graph for exact reference. The GSI’s feedback allows on-the-go adjustments to fine-tune the paving operation.