
No surprise: the top challenge facing state DOTs in improving structurally deficient (SD) and functionally obsolete (FO) bridges is funding, according to our 2015 Better Roads Bridge Inventory. And while maintenance was second on the list of challenges, this year staffing also mentioned as a top-level concern.
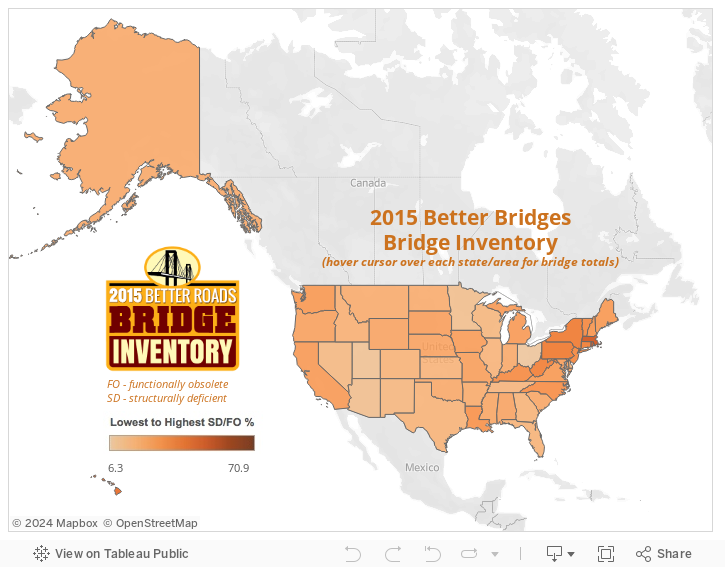
The national average for percentage of SD/FO bridges increased slightly to 21.3 percent this year, from last year’s 20.5 percent. The majority of the SD/FO bridges are rated FO at 11.8 percent (70,691) with 9.5 percent (56,750) being rated SD.
But it’s not all about the numbers. We expanded this year’s survey with more qualitative questions. We asked for details on what preservation techniques states were using to prolong the life of bridges. We also asked for opinions on the Federal Highway Administration’s requirement to rate bridge conditions by the square foot and individual components, such as the deck, instead of by the whole structure.
And, as we review how individual states rank, we’ll look at both the top five states with the lowest percentage of SD/FO bridges, as well as those with the highest percentage of these bridges.
How the States Stack Up:
The Top Five states with the lowest SD/FO Bridges
Ohio
Ohio is the bridge poster child, with only 6.3 percent of the 27,940 bridges listed as SD/FO, a drop of 7 percent from last year. There is one caveat, however. As it did last year, the Ohio Department of Transportation (ODOT) did not list FO bridges, only supplying the number of SD bridges (1,764). The states fractural critical bridge count reached 1,389.
Replacing superstructures would do the most to improve bridges, ODOT says. The state uses this tactic as one of its top rehabilitation techniques. It also uses partial or complete deck replacement and widening.
ODOT reports seven to nine bridges were closed in the past year due to deficiency, structural failure or collapse, with four to six of these being repaired or slated for repair. The department self-rates the state’s bridges a 3 on the scale of 1 to 5. Age is the top factor causing damage, followed by corrosion, more traffic than bridges were designed to carry and heavier loads.


ODOT’s Assistant Administrator Amjad Waheed says FHWA’s new by-the-square-foot bridge rating will be beneficial in making replacement or repair decisions. “Measuring the deck area is more realistic compared to counting bridges. The new rating system will be able to focus on targeted areas.”
Utah
Only 8.7 percent of Utah’s 2,971 bridges are rated as FO/SD, with 179 (6.0 percent) being FO and 78 (2.7 percent) rated as SD. In 2014, 11 percent were FO/SD. Seventy-eight bridges are rated in fracture critical condition.
Adding corrosion-resistant rebar to bridge decks and other concrete areas exposed to salt would improve bridges the most, according to the Utah Department of Transportation. The top rehabilitation measures include partial or complete deck replacement, strengthening and widening.
The department did not close any bridges in the past year due to deficiency, structural failure or collapse. UDOT expects to lower its rate of SD/FO bridges in the coming year due to bridge rehabilitation, retrofit, repair and replacement efforts. It rates bridges in the state a 4 on the 1 to 5 scale, stating while there is room for improvement, bridges are performing as expected. Future challenges, the agency says, are bridges built in the 1960s and 1970s reaching the end of their design service life.
Factors causing the greatest damage to Utah’s bridges include salt exposure/corrosion, followed by more traffic than bridges were designed to carry and age. UDOT completed 12 new bridges and started eight more in the past fiscal year. This fiscal year, the agency plans to complete eight, start eight and plan 20. Bridge funding is up more than 10 percent this fiscal year and is expected to increase more than 10 percent next fiscal year.
UDOT says FHWA’s new bridge rating system will provide better and more detailed information. There are still uncertainties, however, due to inspector variability and the possibility it will take longer to log the additional information required, affecting the time and number of bridges that can be inspected.

Arizona
Arizona has only 10 percent SD/FO bridges out of a total of 7,714, with 2.5 percent (194) being SD and 7.5 percent (578) being FO. This ratio is unchanged from 2014. Fifty of the state’s bridges are in fracture critical condition.
The Arizona Department of Transportation (ADOT) says funding is the top factor that would most improve their bridges, and rated state bridges a 4 on the scale of 1 to 5. Age causes the most damage to the state’s bridges, followed by more traffic than designed to carry and corrosion.
ADOT’s bridge rehabilitation efforts include partial or complete deck replacement, superstructure replacement, strengthening and widening. Preventive maintenance work includes installing deck overlays, sealing concrete decks, sealing/replacing leaking joints and installing scour countermeasures.
Minnesota
Minnesota improved the number of SD/FO bridges by nearly two percentage points, coming in at 10.3 percent out of their 13,918 bridges compared to 12 percent last year. This breaks out to 4 percent (551) being FO and 6.3 percent (881) rated as SD. There are 106 fracture critical bridges in the state.
The Minnesota Department of Transportation (MnDOT) closed one to three bridges this past year due to deficiency, structural failure or collapse, and repaired or slated for repair, the same number of bridges.
Nevada
Nevada ranks fifth in the lowest SD/FO bridge percentage, at 13 percent, but still increased from 11 percent in 2014. Only 2.2 percent (43) of the 1,917 bridges in the state are FO and 10.8 percent (207) are SD. Forty-five are rated as fracture critical.
The Nevada Department of Transportation (NDOT) says funding is the top requirement for improving bridge conditions. The agency’s top bridge rehabilitation technique is widening; preventive maintenance efforts include installing deck overlays, sealing concrete decks and installing scour countermeasures. NDOT rated its own bridges as a 4 on a scale of 1 to 5.
NDOT completed 11 new bridges in the last fiscal year, with an additional six started and five more planned. This fiscal year the agency plans to complete 14 new bridges. The department reported bridge funding was up in the past fiscal year by 6 to 10 percent, but is not certain of funding levels for this fiscal year.
NDOT’s Assistant Chief Structures Engineer Nancy Kennedy doesn’t see the new FHWA system as an aide in making replacement or repair decisions. “Conditions ratings are too specific to limited areas. There is too much information is being gathered and it is slowing the process of making decisions of where to put funding.

The Bottom Five states and areas with the highest SD/FO Bridges
District of Columbia (Washington, D.C.)
As it did last year, Washington, D.C. had the highest percentage of combined SD/FO bridges at 70.9 percent, a dramatic increase from the 57 percent recorded last year. For this year’s figures we relied on FHWA’s most recent National Bridge Inventory, which tracks bridge conditions as of December 2014. There were 14 total SD bridges and 164 listed as FO out of a total of 251.
Rhode Island
Also ranking in a repeat position for a second year, Rhode Island ranked second with 52.2 percent of the bridges in SD/FO condition, just a slight increase from 51 percent in 2014. Out of the total 764 bridges, the Rhode Island Department of Transportation (RIDOT) reported 187 are SD and 212 are rated in FO condition. Thirty-six bridges are considered fracture critical.
In the past year, RIDOT has closed one to three bridges because of deficiency, structural failure or collapse, with the same number of these having been repaired or slated for repair. In rating its own bridges on a scale of 1 to 5 (with 1 being poor and 5 being excellent), RIDOT chose a 2, stating the high percentage of SD bridges (24.5 percent of the total) as the reason.
In the current fiscal year, RIDOT says it has started four new bridges, but hasn’t completed any, and isn’t sure if any new bridges will be started or completed next fiscal year. This could in part be due to the current fiscal year funding for bridges being down more than 10 percent.
The agency says the top preventive maintenance steps used include washing/cleaning bridge decks or the entire bridge; complete, spot or zone coat steel beam/girder ends; and sealing/replacing leaking joints. Top steps for rehabilitation include partial or complete deck replacement, superstructure replacement and strengthening.

Massachusetts
Massachusetts jumped up two spots this year with 51.5 percent of its 5,044 bridges in SD/FO condition, according to the FHWA National Bridge Inventory. Only 36 percent were in this condition last year. FO bridges tallied up to 2,140 (42.4 percent) and 455 (9.0 percent) were SD.
Hawaii
Another repeat state in ranking, Hawaii’s FO/SD bridge percentage hit 42.6 percent, a slight bump from the 37 percent in 2014 reaching this designation. As with Washington, D.C., and Hawaii, these figures came from FHWA’s reporting. Of the 1,134 total bridges 37.2 percent (422) were in FO condition, and 5.4 percent (61) were ranked as SD.
Pennsylvania
The Keystone State reported 36.8 percent of its bridges as FO/SD, a slight improvement from 38 percent in 2014. Of its 22,719 bridges, 3,663 (16.1 percent) were listed as FO and 4,691 (20.7 percent) were rated in SD condition. Total fracture critical bridges totaled 1,295.

Adequate funding would help improve bridges most, says the Pennsylvania Department of Transportation (PennDOT). This includes a bridge asset management system that would help prioritize bridge repairs.
PennDOT says more than 10 bridges were closed in the past year due to deficiency, structural failure or collapse, and those have been repaired or slated for repair. Corrosion causes the greatest amount of damage to Pennsylvania bridges, followed by age, more traffic travelling on bridges than designed to carry and scour/bridge hits
In the past fiscal year, PennDOT planned 260 new bridges, with another 270 planned for this fiscal year. Bridge funding was up more than 10 percent in the last fiscal year compared to the year before, with a 1 to 5 percent increase expected this year.
To address the need for bridge replacement, PennDOT is working through a Rapid Bridge Replacement Program with public-private partnership (P3) Plenary Walsh Keystone Partners, replacing 558 bridges over a three-year period. Fifty-eight bridges are scheduled to be replaced in 2015 through this P3 partnership.

Methodology:
Conducted since 1979, Equipment World’s Better Roads Bridge Inventory is an exclusive, award-winning annual survey that asks bridge engineers across the nation to provide qualitative and quantitative details about bridge conditions. Through consultation with states, the Federal Highway Administration (FHWA) has assigned a sufficiency rating to each inventoried bridge measuring 20 feet or more. Factors for these ratings are outlined in the current FHWA report, “Recording and Coding Guide for Structures Inventory and Appraisal SI&A of the Nation’s Bridges.”
The qualitative data are collected through our questionnaire about major issues concerning bridge conditions and maintenance. In the event a state did not respond to our survey, we used data from FHWA’s National Bridge Inventory. The FHWA’s explanation of structurally deficient and functionally obsolete bridges is available on the Policy & Government Affairs Conditions and Performance section of FHWA’s website. The Equipment World editorial staff would like to thank state highway engineers for their continuing cooperation and special effort to provide current data, which was collected through October 2015.