How infrastructure cuts hurt everybody
By Tom Jackson

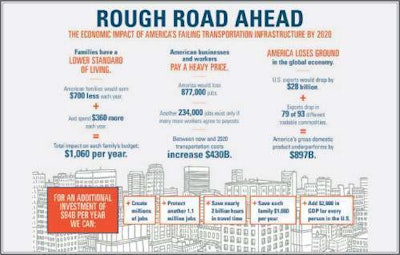
Washington D.C. is in a penny pinching mood, but continuing to starve the Highway Transportation Fund and other infrastructure funds is bad economics, as the chart above demonstrates.
The United States spends less on infrastructure as a percentage of our GDP than any developed county in the world. It wasn’t always this way. Starting in the 1950s and up until the late 1970s we spent almost 6 percent of GDP on infrastructure – and the economy boomed, averaging 4 percent growth a year. Today we spend less than 2.4 percent and the economy is on life support. Europe, by contrast, spends 5 percent. China 9 percent.
Here are some additional facts about the decline of our country’s infrastructure:
• Traffic congestion wastes 4 billion hours and 3 billion gallons of gasoline every year.
• More than one-quarter of all bridges are in need of repairs or handling more traffic than they were designed for.
• One-third of all dam failures since 1874 have happened in the last 10 years.
• America’s aging sewer systems spill 1.26 trillion gallons of untreated sewage every year.
• By 2020 every major port in the country will be handling double the volume it was designed for.
• Airport delays are expected to triple by 2015 thanks to congestion and outdated air traffic control systems.


