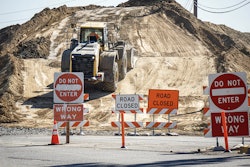
Mississippi DOT workers close deficient bridges. Credit: MDOT
The number of bridges in poor condition has declined since 2014 in the United States but at a slower rate than in the past, according to the American Road & Transportation Builders Association’s new bridge report.
“At the current pace, it would take more than 80 years to replace or repair the nation’s structurally deficient bridges,” says Alison Premo Black, ARTBA chief economist. “That’s longer than the average life expectancy of a person living in the U.S.”
Black conducted ARTBA’s annual analysis of the federal 2018 National Bridge Inventory database and determined that 47,052, or 7.6 percent, of the nation’s bridges are deemed structurally deficient.
Last year saw only a 1 percentage point drop in the number of bridges on the list, the slowest rate in five years.
When factoring in all bridges that need structural repair, rehab or replacement, the list grows to 235,000 bridges, about 38 percent of all bridges, the ARTBA report says. Addressing those bridges would cost about $171 billion, the association estimates.
To make these bridges safer, ARTBA is calling on Congress and President Trump to provide sufficient permanent funding for the National Highway Trust Fund. The fund has been predicted to become insolvent within a few years without more funding. ARTBA says states could see a 40 percent drop in federal highway money starting in 2021 without congressional action. The fund accounts for more than half of annual funding for highway and bridge projects for states.
“America’s bridge network is outdated, underfunded and in urgent need of modernization,” Black says. “State and local government just haven’t been given the necessary resources to get the job done.”
States with most structurally deficient bridges
- Iowa (4,675 bridges)
- Pennsylvania (3,770)
- Oklahoma (2,540)
- Illinois (2,273)
- Missouri (2,116)
- North Carolina (1,871)
- California (1,812)
- New York (1,757)
- Louisiana (1,678)
- Mississippi (1,603)
States/territories with highest percentage of structurally deficient bridges
- Rhode Island (23 percent)
- West Virginia (19.8 percent)
- Iowa (19.3 percent)
- South Dakota (16.7 percent)
- Pennsylvania (16.5 percent)
- Maine (13.1 percent)
- Louisiana (13 percent)
- Puerto Rico (11.7 percent)
- Oklahoma (10.9 percent)
- North Dakota (10.7 percent)