But just in case you want to see these marks, you are now able to do it more easily on the go with news state data and graphics on your Android or iOS tablet when you take a break from your game of 2048 or Angry Birds or catching up on Facebook. (I’m sure you use your tablet strictly for business purposes and catching up on news in a digital format.)
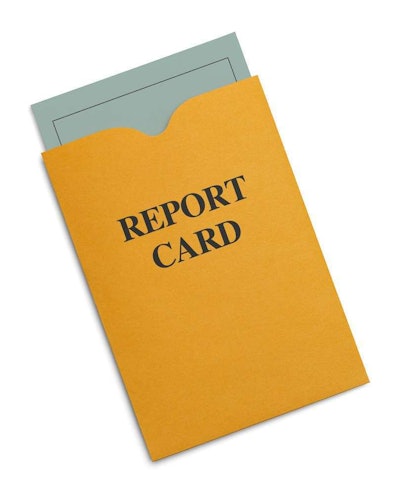
The American Society of Civil Engineers (ASCE) has released an update to its 2013 Report Card for America’s InfrastructureAndroid/iOS app for tablets and website featuring new state data and graphics. The update is available for free download in the Apple App Store, Google Play Store and at www.infrastructurereportcard.org.
It includes new video content, graphs, charts, and 20 new case studies or “success stories” that underscore the benefits of investing in infrastructure. The new success stories highlight some of the following projects throughout the country:
Small Community Airport Access Program (Virginia)
Interstate 95 Pawtucket River Bridge Replacement (Rhode Island)
Ohio Targets Dam Safety Improvements
Wichita Falls Turns Wastewater into Drinking Water (Texas)
San Francisco Public Utilities Commission – Water System Improvement Program (California)
Maine Power Reliability Program
Minnesota Embraces Solar Power
Inner Harbor Navigation Canal Surge Barrier (Louisiana)
Atlanta’s 22-Mile Beltline Park (Georgia)
Birmingham’s Railroad Park (Alabama)
Port of Vancouver Expands Freight Access in Public-Private Partnership (Washington)
Port Everglades and the Florida Department of Transportation’s Strategic Intermodal System
San Bruno Rail Elevation Improves Safety and Helps Revitalize Downtown (California)
Jane Addams Memorial Tollway (Illinois)
Wisconsin Employs 3D Modeling for New Projects
Going for Green at Ohio School Offers Energy Efficiency, Savings, and Learning Opportunities

Hudson-Bergen Light Rail Boosts Economic Development (New Jersey)
Philadelphia Water Department Turns Waste into Energy to Save Big on Power Bills (Pennsylvania)
Pete V. Domenici Federal Courthouse (New Mexico).
The Report Card was originally released in March 2013, and graded the U.S. infrastructure system at a D+. (Yeah, I’d definitely be grounded if I came home with a D+ on my report card!) The need for further investment in the 16 categories documented in the report, including roads, dams, and drinking water are highlighted in the report card.
The app update does not change the grades or evaluation from the 2013 report, but does update the state-level data to provide the most current information of each state’s infrastructure. The Report Card also includes the latest infrastructure statistics for all 50 states and Washington, D.C. With this update, each state’s page now includes the most recent data released on bridges, dams, drinking water, ports, roads, and transit.


