There’s a lot more to it than that, including more cost savings and uptime, if you use the following chart as a basis for your strategies and actions moving forward.
The P-F Curve originated from research performed by United Airlines and the Department of Defense by engineers Stan Nolan and Howard Heap. Nolan and Heap discovered that the traditional approach (using nothing but typical preventive maintenance) was a poor way to manage equipment. Instead, they applied a rigorous engineering process to identify ways to drive down costs, increase uptime and prioritize maintenance activities.

“We’re not trying to eliminate failures,” Ingalls says. “We are trying to eliminate consequential failures.”

What all these charts have in common is that they show how most failures can be detected in advance if effective inspections are conducted. They also illustrate the condition of components as they degrade and approach failure. To help you understand how to decipher the chart, we’ll break it down into three main elements: the P-F curve, its relationship to Maintenance Strategies, and various Proactive Maintenance suggestions.


The P-F Curve
At the top left of the chart above, the “P” represents the point at which component failure or degradation begins. If the degradation goes undetected or uncorrected, it continues down the chart until failure of the entire machine occurs, at the F point. The period of time between P and F, commonly called the “P-F Interval,” is the window of opportunity during which an inspection can detect the pending failure and resolve it through corrective action.
Priority 5. These activities can give you notification of a pending failure months in advance. The first two, ultrasound and vibration analysis, are mostly used in industrial settings, such as to monitoring the health of conveyor belts in quarry and
mining operations. Oil analysis, as mentioned earlier, is a must.
Priority 4. Complete within 30 days. Wear particle analysis, for example, is a subset of oil analysis and looks specifically for wear metals in engine oil samples. Combining oil analysis and wear particle analysis will give you predictive capabilities. For example, when wear metals or particle counts start to rise, you can predict from these indicators that component wear or failure is on the horizon.
Priority 3. Complete within two weeks. When you get to this stage, you are actively looking for problems on a regular or daily basis with a pre-work walk-around checklist. Nothing fancy…just a visual inspection for leaking cylinders, worn undercarriage parts, or anything out of the ordinary. These inspections should correlate to scheduled PMs at specific intervals like miles, metered hours or tonnage.
Priority 2. Complete within five days. Continuing on with the inspection, your operators should report any abnormalities they see, hear, smell or feel when the machine is working. These can include excessive vibration, a funny feel to the controls or driveline, change in sounds, smells (such as unburned fuel or overheated engine oil) or visible smoke.
Priority 1. This is when damage occurs. You’ve already run the machine or component to the point of failure, and work ceases. There is no choice left but to repair it.
Maintenance Strategies
On the inside of the Priorities shell on the P-F curve, you will see a series of acronyms that describe the maintenance strategies associated with those particular time frames. These include:
• PdM: Predictive Maintenance, sometimes referred to as Condition-Based Maintenance (CBM). These are processes that use known engineering limits and technology to detect an alteration in equipment condition. Examples could include oil analysis, vibration analysis, infrared and ultrasonics, to name but a few. It can also include Performance Trending, which uses history to project when the failure will likely occur, so replacements or repairs can be scheduled before the failure.
• PM: Preventive Maintenance. As time passes, you rely on preventive maintenance and visual inspection by maintenance personnel to detect changes in equipment condition. Although you may perform lube and filter changes and other adjustments, the key activity here is inspection at the prescribed intervals to ensure individual components remain in spec.
• OC: Operator Care. As you get lower down the curve approaching the failure event, many changes are more easily detectable. Operators, if trained, can detect those changes before failure occurs by using their senses of touch, hearing, sight and smell. The objective is to use a mixture of physical inspections and technology to detect changes early and prevent failures from occurring.
• EM: Emergency maintenance. These are repairs you must make immediately to prevent a component failure from cascading into a larger, systemic problem.
Proactive Maintenance (ProM)
The vertical column on the left of the chart is a list of practices and programs you should implement to prevent breakdowns. Going from the bottom up, they are:
• OC: Operator Care. One of the easiest and least expensive ways to save on maintenance costs is to make sure your operators are trained to detect physical signs of change in the machine. “A well trained operator can detect 70 to 75 percent of failures in advance,” Ingalls says. They may hear a clicking sound, smell burning rubber or feel excess heat.
• CMMS. Computerized Maintenance Management System. There are numerous computer-based maintenance tracking systems or maintenance modules (on enterprise software systems) you can use to avoid the kinds of oversights and mistakes inherent in paper filing systems. Tracking history and costs can identify culprits and bad actors, therefore reducing failures.
• Planning and scheduling routine, recurring maintenance gives your mechanics and operators advanced notice, so that work in the field doesn’t doesn’t get cut short due to downtime on a critical machine. Job preparation minimizes wasted time and effort for both mechanics and technicians.
• Written procedures should leave no question in the technicians’ minds regarding what steps need to be taken with each maintenance process. An agreed upon sequence (or list of steps) should be developed to standardize the activity and increase reliability.
• Training programs for technicians and mechanics are essential to keep up with new technology and systems.
• RCFA is Root Cause Failure Analysis, and is used in all kinds of industries to determine the cause of a mechanical or system failure to prevent recurrence. Where preventive maintenance looks forward, RCFA looks backwards, and should be done anytime you encounter an unanticipated equipment failure or safety issue that is repetitive or in excess of a certain cost.
• PMO, or Preventive Maintenance Optimization, is what Ingalls calls “a big data scrub.” Using your maintenance software, you can compile reports over time and pick out trends to identify PMs that can be either added or eliminated. These trends will show you what works, and what doesn’t, and where best to spend your time and money.
• FMEA. Failure Mode Effects Analysis. This is a study that determines, specifically, what failures will shut a particular machine down. You figure out which potential failures are the most problematic, and develop strategies and timelines to deal with them. For example, failure of the main bearing seals on an engine is catastrophic. But, failure of the machine’s air conditioning is not, and may not need to be top priority. Strategies include mitigating or detecting as much as possible.
• EEM. Early Equipment Management deals with the proper selection and design of new equipment and facilities to minimize lifecycle costs.
• Equipment ranking. Not all equipment is of equal value, so when planning the order of maintenance activities, this must be considered. Equipment is sorted and classed by its impact or risk level to the organization. For instance, a paver would have a higher classification than a light tower.
• Key Performance Indicators are metrics or measures that reflect how well you are doing, identify what areas require improvement, and measure the impact of those efforts. The adage is, “What gets measured gets done.”
• Vendor control. Often overlooked, vendors can become a weak link in your maintenance processes. By rating them on performance, delivery, customer service, quality and pricing, you can improve results and sometimes lower costs. In your scorecards, also figure in any innovations or unique services they bring to the table. “If they are deficient in some areas, set them up on a corrective action plan so they can get back in line,” says Ingalls. Also, set up a process for evaluating and vetting new vendors.
• Inventory control. Having the right part at the right time is key to efficient maintenance. “But, inventory control also means not keeping one of everything – because you can’t afford it,” Ingalls says. “In this country, it costs about 30 percent of the value of that inventory to keep that inventory in a manned storeroom, and 16 to 20 percent in an unmanned storeroom. So, to keep $100,000 in inventory, it’s going to cost your company about $16,000 to $30,000 in storage costs, theft, pilferage, obsolescence, utilities, personnel and taxes.”
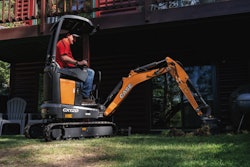
• Precision maintenance is simply the art of making sure each of your machines is in tiptop shape. Make sure your truck frames are aligned so you’re not constantly scuffing the tires. Tighten the fittings on buckets and booms so that the digging arms on your excavators aren’t rattling and causing operators to slow down. Make sure the tracks on crawlers are correctly tensioned to prevent slippages and reduced power to ground. Replace worn fasteners. Also, align pumps in plants.
• Lubrication excellence. No one thing can do more to extend the life of your engines and save money than to have a good oil analysis and lubrication program.