At first, it seems like the typical bad news statistic you tend to get when you ask state Departments of Transportation (DOTs) to comment on the condition of the bridges in their areas: Half of the state bridge engineers responding to our 2016 Better Roads Bridge Inventory said that low funding was their top obstacle in improving bridges.
But this year’s survey results provided an interesting twist: 10 percent fewer respondents cited funding as their top concern than did in last year’s survey.
States take the lead
Perhaps part of the reason for this is that several states have recently enacted methods specifically to fund bridge programs. One example is Nebraska’s County Bridge Match Program, created earlier this year by the state’s Transportation Innovation Act. It will provide $40 million through June 30, 2023, to be used to reimburse a county 55 percent of a project’s bridge construction costs (up to $150,000 for any one bridge).
“Of the approximately 15,000 bridges in Nebraska, about 11,000 are on the county system,” says Kent Miller, assistant bridge engineer, data and inventory for the Nebraska Department of Roads. “These tend to be smaller bridges and make up about 39 percent of the total bridge area in Nebraska. The program is designed to encourage innovative ways to deliver lower-cost bridge construction projects.“
Miller adds the program will allow state and local funding for qualified county system bridges to target reduction of structurally deficient bridges and support design-build programming delivery.
Last year, South Dakota initiated its Bridge Improvement Grant (BIG) program to help fund bridge projects through a wheel-tax fund mandate at the county level. If a county does not collect the tax, they cannot apply for the grant funds. The program allots $7 million per year and the South Dakota DOT is kicking in an additional $2 million per year.
“The Bridge Improvement Grant has had several impacts,” says Laurie Schultz, South Dakota DOT (SDDOT) administration program manager. “The first was the requirement to prioritize county structure replacements based on the condition of the structure and the facility it carries. We require that public meetings be held and the bridge prioritization be discussed.”
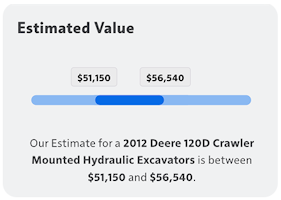
New from Equipment World
Get fast, free estimate values for your used construction equipment
Access one of the industry's largest resale and auction databases with the new Construction Equipment Valuation Calculator
The second impact, she adds, was the decision to no longer fund local bridges with federal funds to allow for more direct control at the state and local level. “We will be completing projects that were programmed through 2018, but will then shift to totally funding local bridge projects with state funds.”
Partner Insights
Information to advance your business from industry suppliers
Finally, Schultz says the agency is encouraging local entities to rehabilitate their bridges and extend their life, rather than “just let them die.”
“We cannot afford to replace all of the aging structures, and need to implement maintenance programs to extend their lives,” she says.
The New Mexico DOT began setting aside $14 million per year for bridge preservation projects back in 2013, prompted in part by the fact that the average bridge age in the state is approaching 50 years.
“The objective of the funding is to extend the service life of these bridges by proactively spending limited funding on actions that minimize deterioration,” says Jeff Vigil, NMDOT bridge management engineer. “Road salts are used in the northern half of the state, which can lead to an escalation in the rate of deterioration of bridge elements if they are not properly protected. The $14 million allows the department to develop approximately 50 minor rehabilitation and/or preventive maintenance projects per year.”
Not so FAST
The Fixing America’s Surface Transportation (FAST) Act, passed late last year, finally gave the highway industry a multi-year funding bill. So, we wondered: Has this money had a positive impact at the state level on the near term future of bridge improvements?
Interestingly, the responses were quite mixed among state bridge officials. Only 46.7 percent of our respondents said yes, with another 40 percent indicating no.
Utah DOT’s (UDOT) Rebecca Nix, bridge program manager, is optimistic about the FAST Act’s benefits. “The new flexibility of National Highway Performance Program (NHPP) funding through the FAST Act—allowing NHPP funds to be expended on any bridge on a Federal Aid route—will allow Utah to better allocate funds to the most critical repairs in our entire system, rather than just the most critical repairs on the National Highway System,” she says.
But South Dakota DOT’s Schultz feels the FAST Act isn’t significant in the context of her state’s bridge improvements. “There are no dedicated funds for bridges in the FAST Act,” she says. “Federal funds require compliance with complex environmental restrictions that take time and resources to manuever through.”
Other factors
Preservation and maintenance came in as the second most common response to our question regarding their top obstacle to improving bridges, accounting for 26.9 percent of the total responses. This is similar to last year’s 24.9 percent total.
Paul Kulseth, bridge management engineer for the Kansas DOT, believes a polymer overlay system for sealing bridge decks would be the best form of preservation in his state, indicating such work would protect the existing deck while sealing out water intrusion.
“This would reduce the amount of patching needed on a future project,” he says. “The less money we spend on maintenance, the more money is available for replacement or major rehabilitation.”
However, limitations on the overlay system’s use, which Kansas has been implementing since the 1990s, comes back to funding.
“Unfortunately, it is somewhat of a luxury item that is not appropriate to apply on a widespread basis in the current budge climate,” Kulseth says. “If we had more available funding and could act on a proactive basis instead of a reactive basis, we would apply the system to more bridge decks. In the long run, if we can apply it at the appropriate time, we would spend less money preserving our overlays and decks instead of just letting them go until they are in bad enough condition that replacement of the overlay or deck is necessary.”
How the states stack up
Overall, the percentage of SD/FO bridges held steady compared to last year, with 20.7 percent of all interstate and state bridges and 22.7 percent of all city/county bridges classified SD/FO.
In order to align with the Federal Highway Administration’s (FHWA) initiative to move away from the SD/FO ratings, this year we asked DOTs to rank their bridges as good, fair and poor. FHWA has yet to make a final decision on exactly how these ratings will be defined, but many states are already using their own methodology. Of the 33 states that reported their good/fair/poor numbers, 48.3 percent of the bridges in those states were rated as good, 41.9 percent fair and 9.8 percent poor.
Mark Dinger, California DOT’s media relations manager, says his agency believes these ratings systems will do a good job of capturing the condition of bridges, but with some limitation. “The new rating system is more closely aligned with the old SD rating, but it doesn’t account for load capacity as directly as the old SD rating did.”
Also new in the statistical portion of our survey were requests for the total bridge deck area rated as structurally deficient. Thirty-six states responded with this information, and the results paint a more positive picture of the nation’s bridges, with only 4.8 percent of the bridge deck area in these states rated in SD condition.
The top five states with the lowest number of SD/FO bridges:
1. Arizona
Arizona is the top state this year, moving up from third place last year. The state reports that 9 percent of its 7,714 bridges are rated in SD/FO condition. Total SD bridges totaled 159, or 2.1 percent, and total FO bridges reached 6.9 percent.
In reporting bridge conditions as good, fair and poor, Arizona listed 62.1 percent as good, 36.2 percent as fair and 1.7 percent as poor.
Clifton Guest from the Arizona DOT’s Bridge Management office says the state plans to continue to lower its rate of SD/FO bridges this year through bridge replacement projects. On a scale of 1 to 5, with 1 being poor and 5 being excellent, he rates bridges in the state at 4, primarily because of the age of the bridges and the number of SD/FO ratings.
2. Minnesota
Minnesota jumped from fourth to second place this year, but maintained the same percentage of SD/FO bridges at 10.3 percent of their 13,964 bridges. The state reported 4.1 percent as FO and 6.2 percent as SD.
Minnesota did not report good/fair/poor condition rankings.
3. Utah
Utah is still a top-performing state, but dropped one spot from second to third with 11.7 percent of its 2,986 bridges rated as SD/FO. Last year only 8.7 percent of its bridges were in these conditions.
The state reports that 2.1 percent of its bridges are SD, and 9.6 percent are FO. Utah says 58.5 percent of its bridges are in good condition, 39.5 percent are in fair condition and 2 percent are in poor condition. The state has a total bridge deck area of 20.85 million square feet, of which 2.72 percent was rated in SD condition.
UDOT Bridge Program Manager Rebecca Nix says she expects to lower SD/FO bridges in the coming year, with 10 of 13 SD bridges programed for a major rehabilitation or replacement within the next three years. “We do expect the FO numbers to fluctuate a little as we finalize load ratings for every structure in the system,” she says.
Nix rated the states bridges as a 4 on a scale of 1 to 5.
4. New Mexico
New Mexico entered into fourth place after not having cracked the top five last year. Of its 3,793 bridges, 13.9 percent are rated as SD/FO. SD bridges reached 5.9 percent of the total and FO bridges made up 8.1 percent.
The state ranked its bridges as 57.1 percent good, 36.9 percent fair and 6 percent poor. Total bridge deck area is 21.6 million square feet, with 9.8 percent rated as SD.
NMDOT Bridge Management Engineer Jeff Vigil expects to lower the SD/FO bridge count with targeted funding toward several SD bridges. He rates the state’s bridges as a 4 on the 1-to-5 scale.
5. Wisconsin
Wisconsin rounds out our top five states with 14.1 percent SD/FO bridges out of a total of 14,116 bridges. Total SD bridges accounted for 8.7 percent and FO bridges reached 5.4 percent.
Wisconsin says 52.1 percent of its bridges are in good condition, 40.2 percent are fair and 7.7 percent are poor. Total bridge deck area is 77.4 million square feet with 12 percent listed as SD.
The bottom five states and areas with the highest number of SD/FO bridges
51. District of Columbia
Washington, D.C. still has the highest percentage of combined SD/FO bridges – 68.5 percent of 254 bridges – a position it’s maintained since 2012. As the District Department of Transportation did not respond to our survey, we relied on FHWA’s most recent National Bridge Inventory. The nation’s capital had 10 SD bridges and 164 FO bridges.
50. Rhode Island
As it did last year, Rhode Island ranked second from the bottom, with 52 percent of its 773 bridges rated SD/FO.
Total SD bridges made up 24.8 percent of the total, with FO bridges reaching 27.2 percent. Bridges rated as good totaled 16.3 percent; fair, 58.7 percent; and poor 25 percent. There’s a total of 82,302 square feet of bridge deck surface in the state, with 25.4 percent of that rated as structurally deficient.
The Rhode Island DOT rated its bridges as a 1 on the 1 to 5 scale due to the age of the bridges and impact of the weather. However, during the next fiscal year, the state plans to start 98 new bridges and complete 26, with another 85 in the planning stage.
49. Hawaii
Hawaii has moved from fourth to third from the bottom in the number of SD/FO bridges. Out of its 1,112 bridges, 61 were considered SD and 414 rated as FO.
Hawaii did not provide good, fair or poor ratings, but did report total deck surface area of 12.5 million square feet, with 5.6 percent rated as SD.
48. New York
With 37.7 percent of its bridges rated SD/FO, New York is now positioned fourth from the bottom. SD bridges totaled 1,948 out of 17,498, with 4,643 being rated FO.
The state ranked 12.7 percent of its bridges as good, 57.9 percent as fair and 29.4 percent as poor. There’s a total bridge deck surface of 142.6 million square feet, with 24.3 percent rated SD.
Erica Westhuis, bridge data services unit supervisor for the New York State DOT, says lower federal funding amounts and a shrinking workforce lead her to be uncertain as to whether the state will be able to lower the SD/FO rate for next year. “In addition, the environmental effects, such severe weather events, and volume of traffic in the state tends to increase the deterioration rates on our bridges.”
47. West Virginia
Ranking barely better than New York, West Virginia reported 37 percent of its 7,162 bridges in SD/FO condition. SD bridges totaled 17.8 percent of all bridges, with FO slightly higher at 19.2 percent.
West Virginia ranked 34.5 percent of its bridges as good, 47.9 percent as fair and 17.6 percent as poor. The state has 41.3 million square feet of bridge deck surface area, with 45.2 percent rated SD.
“Legislation to generate more state transportation funding would be a start in improving our bridges,” says Kyle Stollings, director of maintenance for the West Virginia DOT. “It would allow our DOT to not be as reliant on federal funding and would give us a little more flexibility and efficiency in project delivery. Investing in infrastructure would provide an economic benefit to the state as a whole.”